Under hösten så har Johannas Stadsodlingar, Tebrito och Ecoloop arbetat tillsammans med flera myndigheter i ett projekt som heter One Stop Myndighetsshop. Livsmedelsverket har varit ledande myndighet och har arbetat tillsammans med konsultfirman Antrop.
One Stop Myndighetsshop har beskrivits som:
En myndighetsöverskridande samverkansmodell för att framtidssäkra en hållbar och attraktiv matsektor med innovationshöjd i toppklass.
Från slutpresentationen
Johannas och Tebrito valdes ut av myndigheterna för att det väl representerar många av de utmaningar som finns med gamla lagar, regler och praxis som skapades för ett linjärt matproduktionssystem, nu när vi ställer om till cirkulära metoder.
Slutpresentationen livesändes och kan hittas här på YouTube.
English
During the autumn, Johannas Stadsdodlingar, Tebrito and Ecoloop worked together with several authorities in a project called One Stop Myndighetsshop (One Stop shop for Laws and Permits). The Swedish Food Agency has been the leading authority and has worked together with the consulting firm Antrop.
One Stop Myndighetsshop has been described as:
A multi-agency collaboration model to future-proof a sustainable and attractive food sector with top-class innovation.
From the final presentation in the project.
Johannas and Tebrito were selected by the authorities because they represent well many of the challenges that exist with old laws, regulations and practices that were created for a linear food production system, now that we are switching to circular methods.
The final presentation was broadcast live and can be found above on YouTube.
Vårt forsknings- och utvecklingskonsortium har fått ytterligare ett projekt beviljade inom cirkulär matproduktion.
Målet med projektet är att ta fram underlag för fortsatt stöd till myndigheter kring regelverk och policys, både nationellt och på EU-nivå, runt en cirkulär värdekedja för livsmedel och samtidigt främja ett proteinskifte genom insekter. Projektet sammanfogar och fortsätter arbetet från flera av de tidigare projekten.
Our research and development consortium has had another project granted in circular food production.
The goal of the project is to develop a basis for continued support to authorities regarding regulations and policies, both nationally and at EU level, around a circular value chain for food and at the same time promote a protein shift through insects. The project joins and continues work from several of the previous projects.
Det är ett rent nöja att kunna berätta att våra forsknings- och utvecklingskonsortium har fått ytterligare två nya projekt beviljade inom cirkulär matproduktion.
Det första är ett projekt som heter: Framtidens foder för fågel, fisk och fläsk. Målet med projektet är att skala upp de pilotprojektet som utförts tidigare (Fem to grön fisk i disk) där restströmmar från livsmedelsindustrin blir foder för insekter, som sedan blir del av fodret för fjäderfä, fisk och gris. Projektledningen för projektet är SLU och Axfoundation.
It is a pure pleasure to be able to tell you that our research and development consortia have received two more new projects granted in circular food production.
The first is a project called: Future feed for poultry, fish and pork. The goal of the project is to scale up the pilot project that was carried out earlier (Five to green fish in a dish) where waste streams from the food industry become feed for insects, which then become part of the feed for poultry, fish and pigs. The project management for the project is SLU and Axfoundation.
Våra forsknings- och utvecklingskonsortium har fått två nya projekt beviljade inom cirkulär matproduktion.
Det första är ett projekt som heter: Cirkulärt matavfall blir mat igen. Projektet kommer att genomföra forskningsexperiment för datainsamling för att möjliggöra riskbedömningar. Uppgifterna ska validera hypoteser om hur regleringar skulle kunna bli mer effektiva och anpassade för en framtid där vår hantering av matavfall kan bli cirkulär. För mer information, kontakta: Fredrick Regnell på Ecoloop.
Our R&D consortium has had grants for two more projects approved around circular food production.
The first project which is called Circular food waste becomes food again (linked page in Swedish). The project will execute research experiments to produce data to make risk assessments. The research is to validate the hypnotises around how rules and regulations could become more effective and adjusted for a future where our handling of food waste become more circular. For more information, contact: Fredrick Regnell at Ecoloop.
This is a description of how we at Johannas Stadsodlingar (urban farms) and Concinnity together have built Johanna’s aquaponic pilot facility. We want to share how we did it and our thinking behind it. There is quite a lot to think about, so there will be several posts to cover most things.
Part 6 – distributed ledger/block chain integration (this post)
Cultivation Management Platform
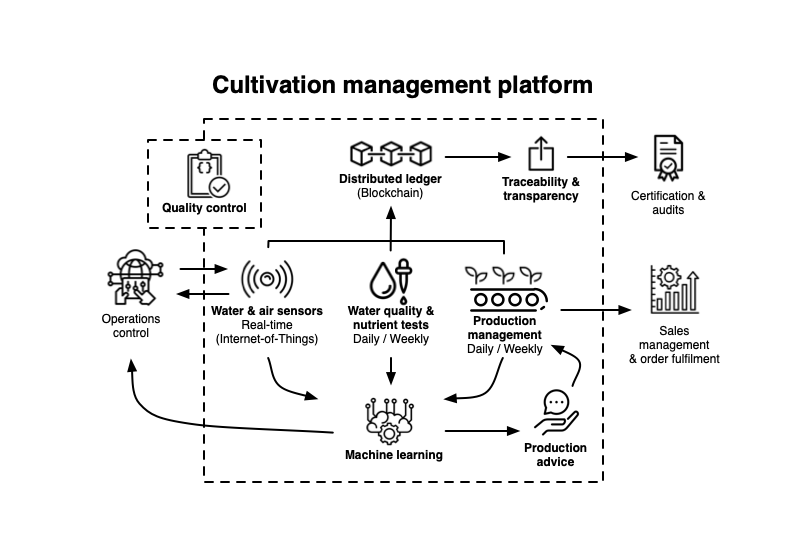
The digital systems we have built are based around the vision we set out with at the start of the project. We call it the Cultivation Management Platform.
Cultivation Management Platform, Copyright 2019 Johannas Stadsodlingar AB. Some rights reserved. Creative Commons BY-SA-NC 3.0.
The CMP consists of four parts:
Water quality and nutrients tests
Water, air and automation sensors
Production management
Distributed ledger / block chain
In this part we will describe our work around integrating a distributed ledger/block chain system.
We have built a system that demonstrates how to use a distributed ledger. A distributed ledger is a database that can be shared between many different parties, where all parties jointly control the information and where all data stored is ”permanent”, i.e. it can in principle not be changed after having been recorded. This may sound very impractical, but instead of changing data you create a reference to the original information and add a change. In this way, all changes to the database become visible to all parties. The blockchain is the underlying technology used to ensure that the information stored in the database cannot be changed afterwards. (This is of course a very simplified description of how a distributed ledger works in practice!)
We have gained access to IBM Food Trust (IFT) to build our blockchain demonstration in collaboration with IBM and Atea, a Swedish IBM partner. IFT is a distributed ledger based on the open-source software Hyperledger that implements a blockchain-based database. IFT provides APIs for storing data in and retrieving data from the blockchain.
System overview
Data from our production tracking system is transformed to ”fit” in IFT and sent there for storage (XML Gen). This is done using automation so that data in IFT is continuously synchronized with the production tracking system. A second part, Data display, retrieves information from IFT. We present a list of all harvests that have been made and you can choose a harvest to get a detailed description of all the steps that this particular plant went through on its way from seed to finished product.
Data
The data we store in IFT is based on the core of the data we generate in the production management system. This includes every step in the tracing of a plant from germination to harvest. All data stored in IFT gets unique IDs which we then use when we retrieve information from IFT in the client app (Data display). In this way, we have been able to build the client so that it does not depend on any part of the original information from the production tracking system, but all information comes from IFT.
Implementation
The system consists of two parts. The first part, XML Gen, retrieves data from the production tracking system and, after transforming this data into XML, sends to IFT for storage on the blockchain. The second part, Data display, retrieves data from IFT and presents it as web pages. This part fetches the information from IFT, where data is delivered in the JSON format, and after transforming this data, we create views as web pages. Note that the Data display is completely independent of the original information stored in the production management system. Data display part can be run as a completely independent service since it retrieves all necessary information from IFT.
XML Gen
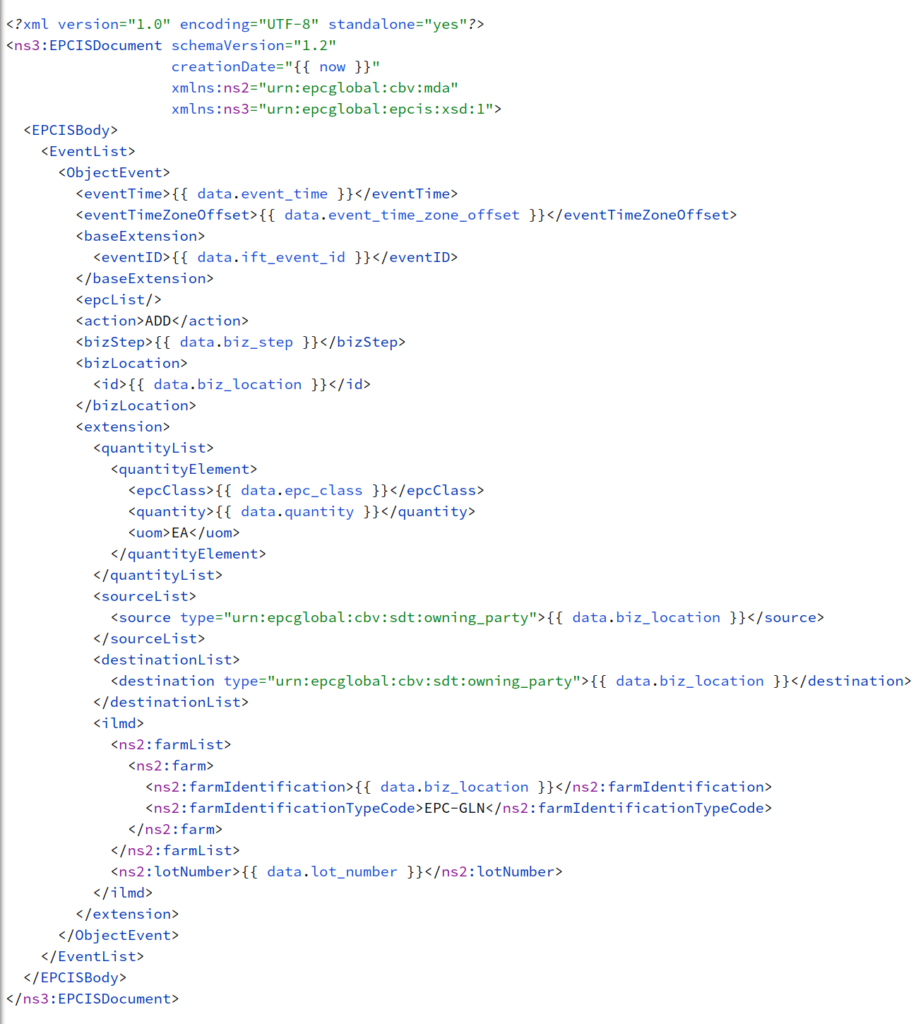
It turns out that the events we create in the production management system can be translated into similar events in IFT. The data we store in this way in IFT is based on GS1 EPCIS Standard 17. We have created an XML template for each type of event which is filled in with data for the current event and then uploaded to IFT. In addition to this information, we register every combination of seeds and suppliers we use as ”products” in IFT, as well as a ”location”, our aquaponics farm. These templates are based on GS1 GDSN Standard 18 and data in IFT is created in a similar way from a combination of XML templates and data from the production management system. IBM has a wiki on GitHub with information about how they use these standards, about the APIs of IFT etc that we have benefited a lot from.
Commission-event XML template
IFT defines a number of different events and we have used three types to register our data; Commission, Observation and Transformation. These three events are defined in EPCIS. The Commission event is used when a new unit of a particular product is to be registered. We use this event to register the production management system Plant event. Observation is used to register a change in an existing unit. We use this type of event to register the events Seedling and Harvesting from the production management system. Finally, we use a Transformation to record our Plant events. It transforms one product into another. In our case, we transform a seedling into a plant. This models well the practical transfer of the seedlings from the cultivation tray to the rafts where they grow into finished plants.
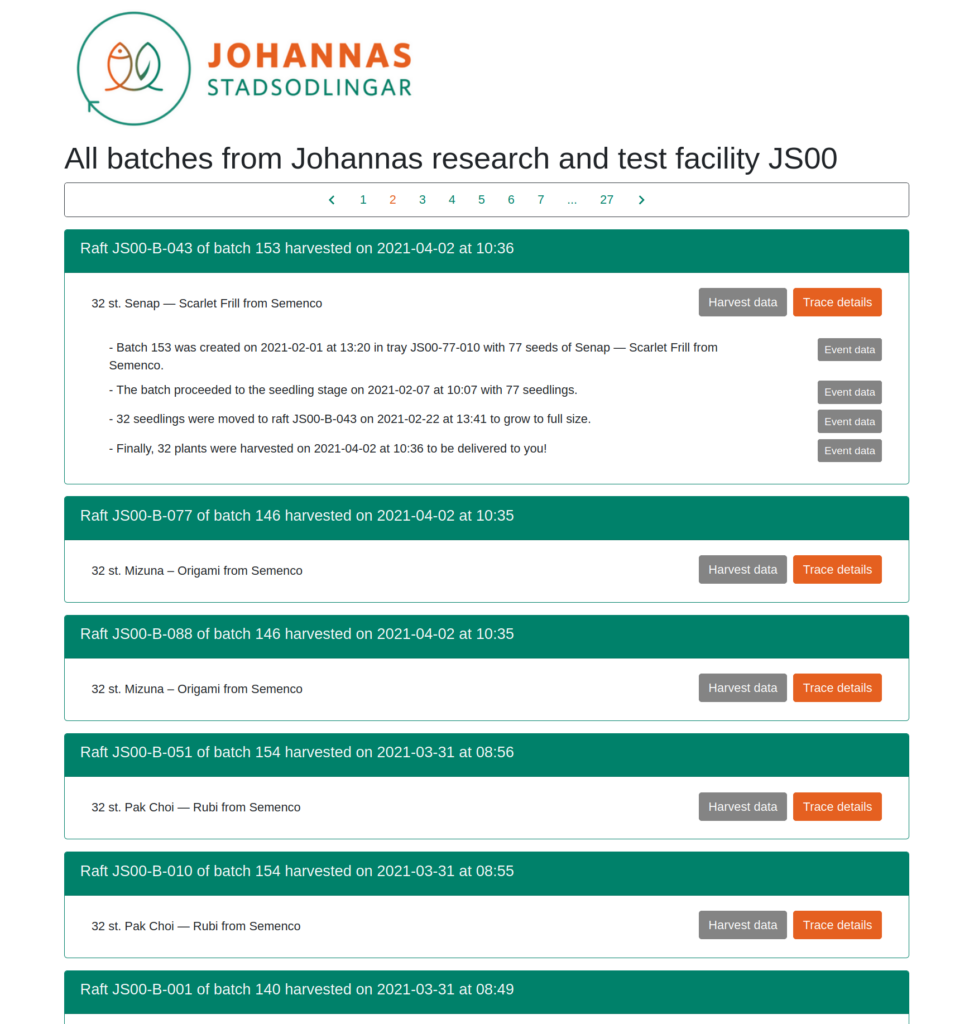
Data display
Data display
Data display retrieves data from IFT via several API calls (endpoints). With the help of the call “/ products” we get a list of all registered products. Based on this list, we can then retrieve details about each harvest. Then we retrieve complete product data for each harvest so that we can show what type of plant and supplier it consists of. Finally, we use the call “/ trace” to get the “history” for each harvest, ie the four events in the plant’s life. In this way we can show the full history of each harvested plant.
Discussion
This prototype is very minimalistic, but it still includes the fundamental parts of a blockchain-based tracking system. We could deliver our products with a label in the form of a bar or QR code, which would link to a website where the buyer can get the full history of how the plant came to be.
[track’n’trace image?]
At present, there is no information about what happened to the product from the time it was harvested until the customer has it in their hands, but if you also trace this part, the chain could be extended and the entire process could be documented on the blockchain in IFT. That part of the tracking could be done by a delivery company and/or by the store that sells the product. The various parties would store “their share” of the information separately in the blockchain at the same time as the customer can see the entire resulting sequence of events.
In the future we could also include more information like the environmental ”footprint” of the product and its nutritional value. This would of course require more thorough data gathering and analysis on our end than we are capable of at present, but it is definitely something we are discussing.
This concludes our series Build an aquaponic indoor farm. At least for now!
This is a description of how we at Johannas Stadsodlingar (urban farms) and Concinnity together have built Johanna’s aquaponic pilot facility. We want to share how we did it and our thinking behind it. There is quite a lot to think about, so there will be several posts to cover most things.
Part 6 – distributed ledger/block chain integration (coming soon)
Cultivation Management Platform
The digital systems we have built are based around the vision we set out with at the start of the project. We call it the Cultivation Managment Platform.
Cultivation Management Platform, Copyright 2019 Johannas Stadsodlingar AB. Some rights reserved. Creative Commons BY-SA-NC 3.0.
The CMP consists of four parts:
Water quality and nutrients tests
Water, air and automation sensors
Production management
Distributed ledger / block chain
In this part we will describe our work with the production management system.
Production management system – overview
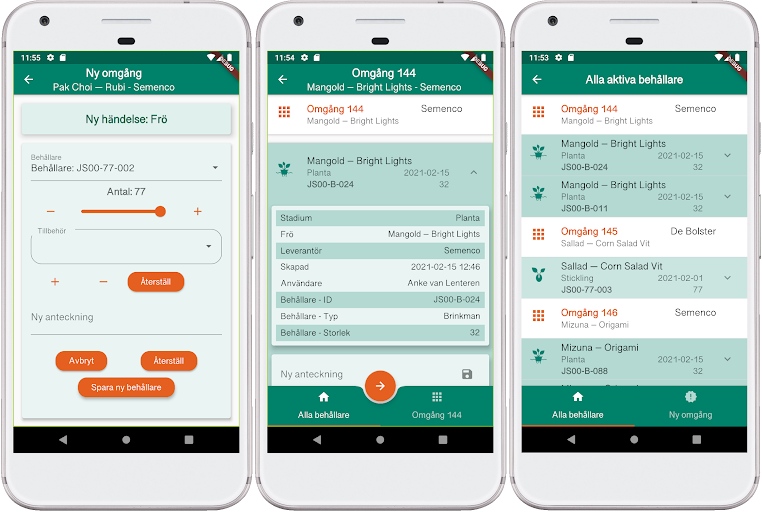
With digital tracking, or production tracking, we collect data on how the cultivation itself is progressing. The main components of this system are a mobile app and a cloud-based service with which the app communicates. With the mobile app, we record every significant event during a plant’s path through the system, from seed to finished lettuce head! All data is stored in the cloud service and is accessible both from the app and from an administrative interface in the service.
Production management mobile app
Cultivation process as data
The cultivation process is organized in what we call batches, where one batch is one or more germination occasions of the same seed made at the same time. As a plant goes from seed to harvest, we generate and record four events that we call Seed, Seedling, Plant and Harvest. Each batch in turn consists of one or more ”containers” where the plants grow. At the start of a batch, the seeds are placed in substrates in trays with between 77 and 150 plants. These trays stand on a cultivation table, a shallow basin with a few centimeters of water. The tray is covered with a plastic hood for higher temperature and humidity. The first event, Seed, is recorded when we sow a tray.
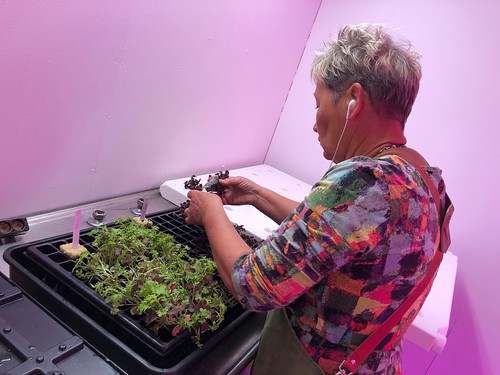
Anke moving seedlings from a tray to a raft
The germination period is about a week long, after which the tray is moved to another cultivation table where the seedlings can continue their growth for a few weeks. When this move is made, we register a Seedling event. How long the plants spend as seedlings depends on the type of plant.
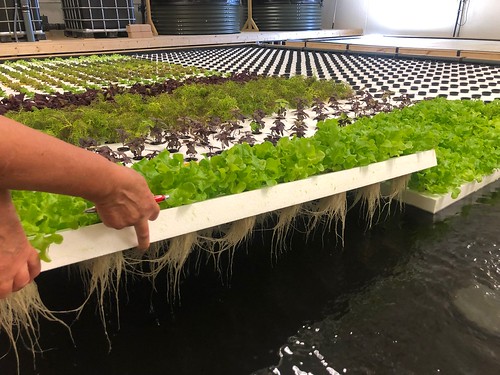
When the seedlings have grown to the right size on the tray, it is time to move them out to the large cultivation basins. This is done by moving each individual plant to a raft. The rafts are just under a square meter in size, and hold 30 or 32 plants. The two different types of rafts have different sized holes where the plant is placed and are therefore suitable for different types of plants. For each raft, we register a Plant event. After a number of weeks on the rafts, again for different lengths of time depending on the type of plant, the finished plants are harvested. This is usually done the same day or the day before they are delivered to the customer. For each raft that is harvested, we create a Harvest event.
A raft is being brought out for harvest
For each event, we record the time of the event, who does the registration, and the number of plants that are currently on the tray or raft. For example, some seeds have not germinated properly and we register the loss when we create the Seedling event. In the case of Seed and Plant events, we register the ID of the cultivation tray or raft used. You can also add a free text note. In addition, the following data is stored for the various events:
Seed: seed variety and supplier, ID of cultivation tray, number of seeds and any cultivation accessories used
Seedling: the number of seedlings
Plant: raft ID and the number of plants
Harvest: the number of plants harvested
Implementation
The production management system consists of two main parts; a mobile app and a server with which the app communicates via HTTP and where we store the data registered via the app. The app is built with the Flutter framework. Flutter makes it possible to create apps that use the same source code but can run on both Android and iOS-based phones and tablets. The cloud service is built with the Django framework, a framework for all types of HTTP-based backend solutions. In addition to Django, we also use PostgreSQL as a database and Hasura which provides a GraphQL API to the database.
In the next post we will have a look at our distributed ledger/block chain integration.
This is a description of how we at Johannas Stadsodlingar (urban farms) and Concinnity together have built Johanna’s aquaponic pilot facility. We want to share how we did it and our thinking behind it. There is quite a lot to think about, so there will be several posts to cover most things.
The digital systems we have built are based around the vision we set out with at the start of the project. We call it the Cultivation Managment Platform.
Cultivation Management Platform, Copyright 2019 Johannas Stadsodlingar AB. Some rights reserved. Creative Commons BY-SA-NC 3.0.
The CMP consists of four parts:
Water quality and nutrients tests
Water, air and automation sensors
Production management
Distributed ledger / block chain
In this part we will describe our work with Water quality and nutrients tests.
An aquaponic farm is an ecosystem with many ”moving parts” and you need continuous, precise monitoring of it with the help of both manual and automated systems. On top of that it’s important for us to acquire as much knowledge as possible about the ins and outs of how the system actually works, like how long time different plants take from seed to harvest, how much the fish grow and so on. We use our CMP to achieve these goals with the help of modern technology in combination with our knowledge on plant and fish cultivation.
Water quality and nutrients tests
To get an understanding of an aquaponics system and to be sure that ”everything’s all right” we need to make regular tests of the water to be able to discover any problems that might arise and to analyze how the water quality affects the system as a whole.
When the system was started and the bacterial culture for the nitification process was built up, we took measurements every day to get good control and understanding of the growth process. Now, when the system is up and running in a stable manner, we measure most indicators once a week.
We had initially planned to use a system for data collection and analysis that we have worked with before, Avo Flow by Akvo Foundation. Akvo Flow consists of an Android based app for data collection with a web based backend for admin and visualization tools, along with an integration with photo-metric and other water quality sensor systems called Akvo Caddisfly. However we realized that the amount of reagent chemicals needed was larger than what was advisable in our fairly small pilot system.
Thus we chose to use a combination of photometric and other sensors from different suppliers. One of the down sides of this is that these other components have very poor or totally lacking digital integration, so we now have a large spreadsheet instead for all the data we collect this way.
Digital monitoring – Water, air and automation sensors
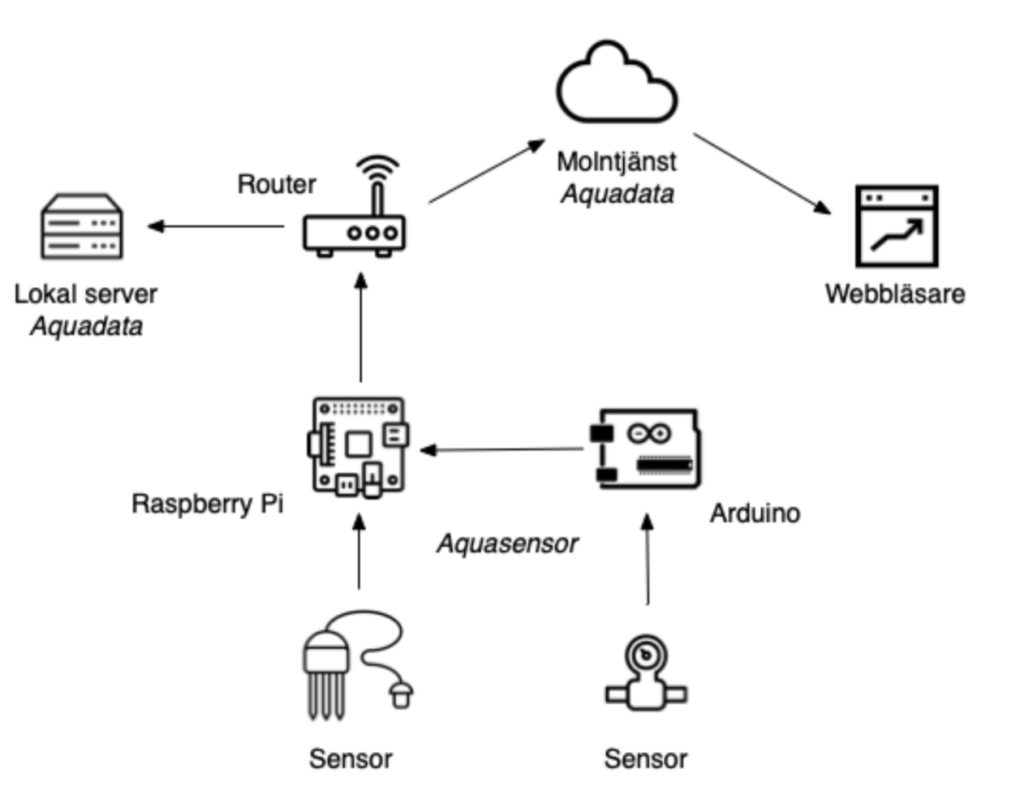
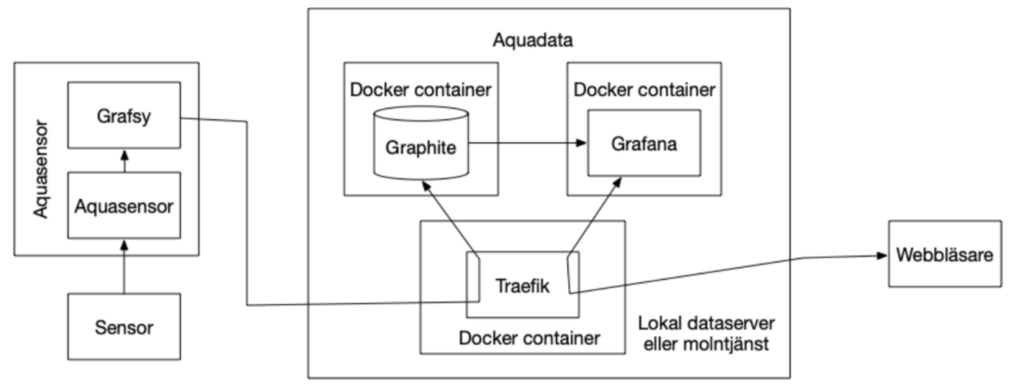
The system we developed for collection, storage and presentation of real-time data consists of two main parts. The system that collects the data is called Aquasensor and the system for storage and display of the data is called Aquadata.
An overview of the digital monitoring system, Aquasensor and Aquadata
Critical indicators as well as indicators that are relatively easy to measure are automatically measured every minute by the sensors. These sensors are connected to Aquasensor which is a tailor-made program written in the programming language Python. Aquasensor communicates with the sensors and collects raw data which is converted into measured values and then, via a buffer program, Grafsy, sends this data to the storage part of the system. The following are the most important indicators we measure:
Indicator
Sensor
Comment / unit of measure
Electricity usage
Electricity meter with pulse output
1 pulse/Wh (1000 pulses/kWh)
Light
TSL2561
Lux
Air: temperature
Sensirion SCD30
°C
Air: humidity
Sensirion SCD30
%
Air: CO2
Sensirion SCD30
ppm
Sensor hub, CPU-usage
The Linux operating system
Sensor hub, mains electricity
230-volts relay
on/off
Sensor hub, network packets
The Linux operating system
Sensor hub, SMS signal strength
3G-modem, Huawei E303
% or dBm
Water: electric conductivity
Sensorex CS150TC
mS/cm
Water flow
XKC-Y25 inductive detector
on/off
Water intake
Water meter with pulse output
53 pulses/liter
Water: dissolved oxygen
Vernier Optical DO
mg/l
Water: level measurement
Ultra sound sensor, JSN-SR04T and a float switch
cm
Water: pH
Sensorex pH2000
Water: temperature
Dallas DS18B20
°C
Drum filter cleaning
230-volts relay
on/off
Weather: humidity
USB-connected electronic weather station
%
Weather: temperature
USB-connected electronic weather station
°C
Weather: air pressure
USB-connected electronic weather station
hPa
Indicators and equipment for automated sensors
The storage and display system, Aquadata, is based on the two open source software systems Graphite och Grafana.
System architecture of Aquasensor and Aquadata.
Graphite was originally a tool for monitoring computers. It has a database that is tailored for storing time series and is therefore well suited for other time-oriented data, such as sensor data from our aquaponics.
Grafana is a tool for visualizing data, with enormous flexibility in terms of the ability to combine information into larger dashboards. Several graphs can thus coexist on one screen and each graph can contain several different types of data, combined in a logical way.
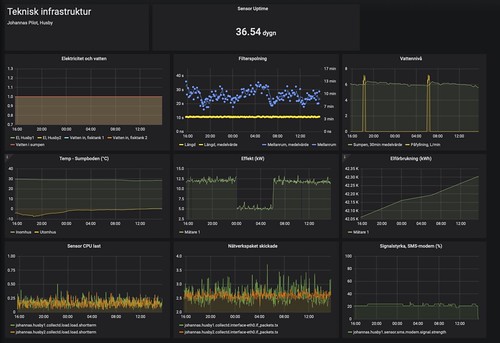
Grafana dashboard with data from Johanna’s pilot site
System implementation – Aquasensor
Aquasensor runs on RaspberryPi computers, we call them the ”Pies” or sensor hubs. We currently have two of them that collect data from different parts of the cultivation. Every full minute, data is collected from the sensors. Aquasensor uses a supporting software, Grafsy, to temporarily store the collected information. In turn, Grafsy sends data to the Aquadata storage system. Grafsy ensures that all information is delivered and data from several hours of measurements can be stored if communication with Aquadata is temporarily interrupted. A sensor hub can also have a ”sub-hub” which is an Arduino computer with sensors. Some sensors are easier to communicate with from an Arduino. Since power outages can occur, the Pies have backup power in the form of battery packs. They are of the same type that you can use to charge your mobile phone. In this way, Aquasensor can continue to monitor the cultivation even if the power goes out. If reserve power is available to the router, Aquasensor can continue to send data even during power outages, if the router does not work, the information is buffered in Grafsy until communication is re-established.
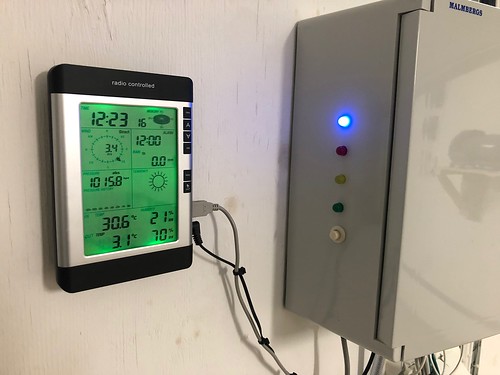
Aquasensor connected to an electronic weather station (which uses wireless communication to get data from sensors on the roof).
System implementation – Aquadata
Aquadata is a system built around the open source software Graphite and Grafana. Graphite stores all information from the sensors and Grafana presents data in graphs that can be collected in dashboards. With these two systems as a base, we have built a cloud service that enables storage of sensor data over the Internet and access to the information in the same way.
Data and time series
Data collected by Aquasensor is sent to Aquadata. There it is stored in Graphite, a database that is tailored for storage of so-called time series, i.e. data containing a timestamp. When Aquasensor sends data from a sensor, it is in the form: ”name timestamp data”.
The configuration of the storage is automatic, when a measured value enters Aquadata, it is automatically added to the named series. If the name does not exist, it is created in the database and the information is added there as a first entry.
The name of the measured value, johannas.husby1.sensor.luft.co2.stickling, contains a lot of information that specifies the kind of data we’re sending. The name is is made up of sub-names in a hierarchical structure. The first two parts of the name, johannas.husby1 is the facility we send data from. Then follows what type of data it is, sensor.luft.co2, i.e. carbon dioxide, and finally the name, stickling, of the sensor from which the measured value comes, in this case the sensor in the seedling room. Using this type of hierarchical names you can build logical structures for your data which in turn makes it easy to find the right information when it is to be presented in graphs.
The next part of the data is the timestamp, 2020-12-14T02:16:00+02:00. Most measurements are made every full minute, with the exception of EC (electric conductivity; measured by running a weak current through the water) which is made on the half minute so as not to interfere with the pH that is easily affected by it.
The last part of the measurement is the measured value, i.e. the data itself, 348. The unit is specified when creating the visualizations and is not part of the value, but is in most cases obvious. In the case of carbon dioxide content, it is ppm, parts per million.
Graphs and dashboards
The collected data is presented by Grafana, an open-source software for visualizing data. With Grafana, we have built dashboards, information panels where we collect information that ”fits together”. We currently have three main panels, Water, Cultivation Rooms and Tech infra, technical infrastructure. The water panel shows the values for temperature, oxygen content, pH and electrical conductivity. The Tech infra dashboard shows more ”physical” measurement values such as electricity consumption (and that we have electricity at all!), the system’s water level (to be able to alert if we get a major leak) and monitoring of the drum filter whose activity is indirectly an indication that the system is OK. The Cultivation Room panel shows the measurements we take in the seedling room, such as temperature, humidity and carbon dioxide content.
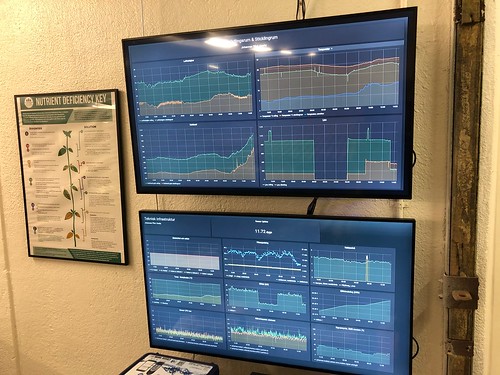
Grafana dashboards on TV screens at the pilot site
Alterts
Aquasensor and Aquadata have two integrated alerting systems. On is SMS-based and sends an SMS to a list of telephone numbers in the event of an alarm condition. The second system is an integration with the cloud service PagerDuty, which can be configured to send alarms via: email, SMS and phone calls.
Digital security
Our monitoring system is explicitly not to be used to control the aquaponics. We are of the firm opinion that in the future it may be very difficult to protect ourselves from external actors who want to disrupt and/or destroy our computer systems, or to exercise digital blackmail by, for example, breaking into our system, encrypting the computer disks and request money to unlock data again. In systems that operate critical infrastructure, such as our fish farming, this should not be possible and our control systems are air-gapped, i.e. have no digital access from the internet or other external networks. This means that the data flow in our monitoring systems only goes in one direction: from the sensors to the local data server and on to the cloud service.
In the next post we will take a look at the Production managment system.
This is a description of how we at Johannas Stadsodlingar (urban farms) and Concinnity together have built Johanna’s aquaponic pilot facility. We want to share how we did it and our thinking behind it. There is quite a lot to think about, so there will be several posts to cover most things.
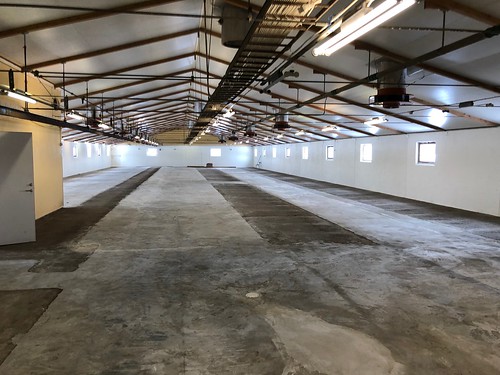
There are quite a few parts to the work of building a pilot plant for aquaponics. When we started, we thought it might take 9 months to do the job. We were wrong. It took almost two years. We worked mostly in the evenings and weekends during the first 9 months. After that, one of us started working full time in the company and during the past year we have also had additional help full time. We did not spend all the time building, but a large part of the time was spent on construction.
The building we are in a is an old farmhouse for cows, built in the eighties. It is 900 squremeters, and about 55 meters long and 16 meter wide internally.
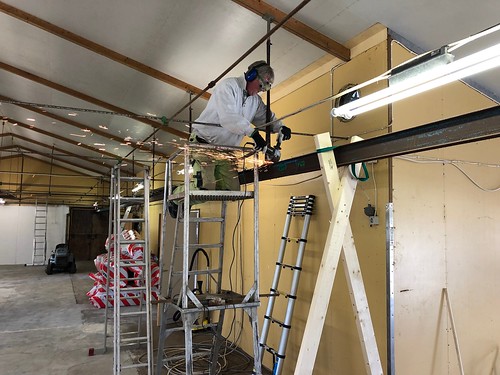
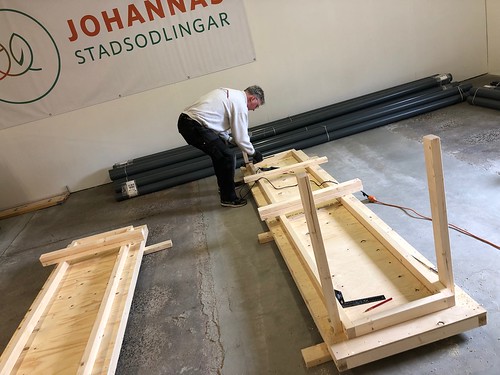
First we had to remove old equipment, such as the milk tank and the traverse for the feed wagon. Below, it is Micke who cuts the I-beam for the traverse where we would build the wall.
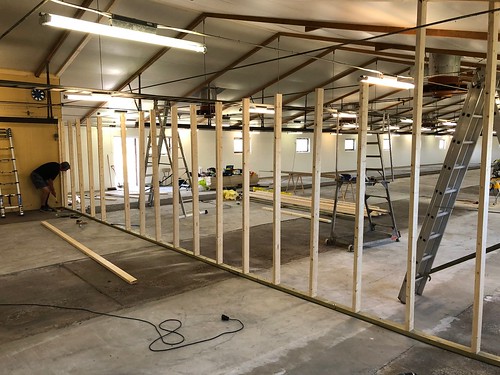
We chose not to use the entire building for the pilot plant, so needed to build a dividing wall. Here we see when Thomas, Micke and William are working on it.
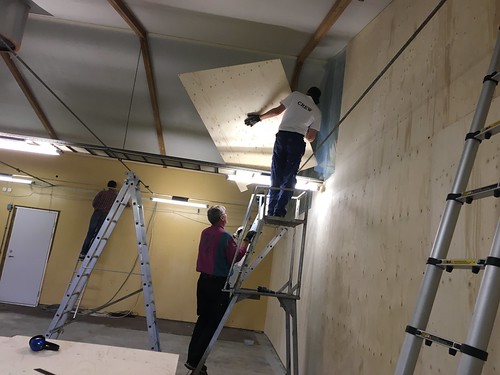
The building had not been used (other than temporarily as a warehouse) for almost 15 years, see we needed to clean everything: walls, roof, cable ladders. It was a lot of work. Here Anke Johanna cleans the ceiling.
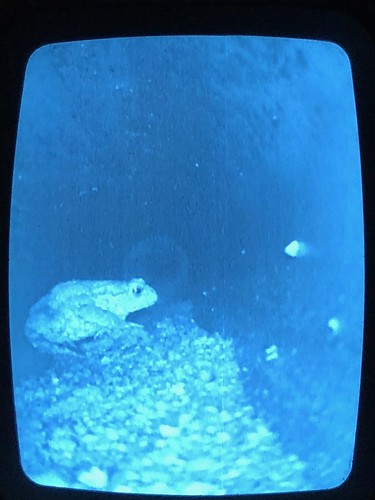
We needed to inspect the drains to make sure they did not have any serious leaks. The drains are used to carry faeces from the fish to an external manure tank. Here Rasmus helps us to inspect the pipes.
In the drain we found a toad that seem to live there during the winter.
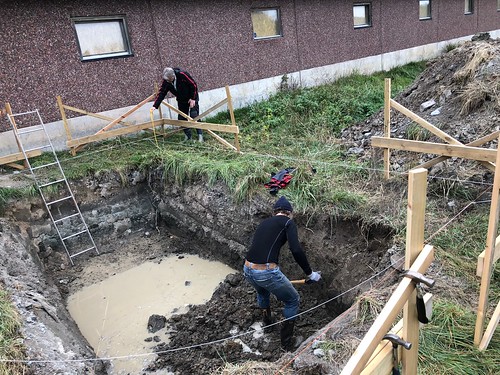
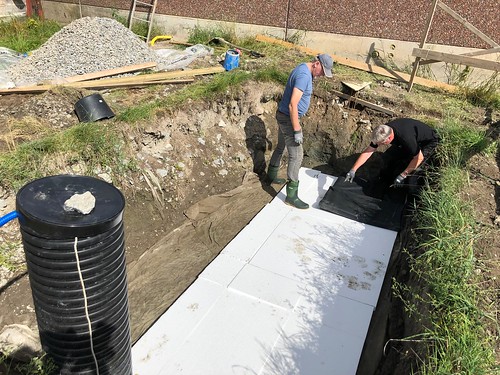
We had decided to have an external sump tank. We needed to know that it could be dug at the location we chose and that it would not reach the bedrock, so we enlisted the help of a neighbor who dug a test hole with an excavator. The ”test hole” became large enough that we could improve it a bit by hand (William digs and Micke measures where to put the building) to later use as a hole for the sump tank. The hole was not really straight, as you can clearly see later.
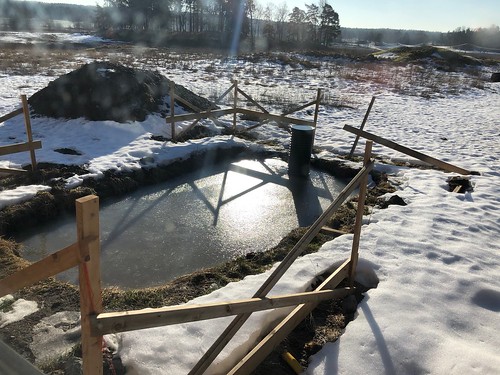
Work went a little slow so before we could work more on the sump tank and the building on top of it, the winter arrived and the hole was filled with groundwater and froze.
We built a sump tank structure in wood, which Mikael was happy with, that we later dressed in a rubber lining.
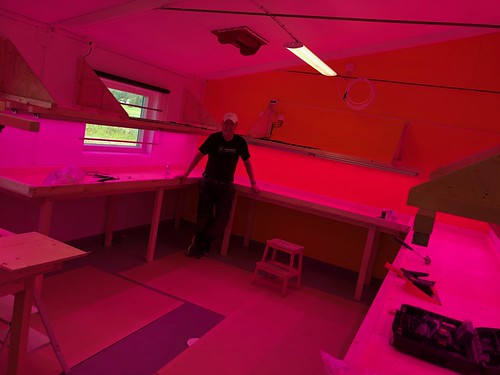
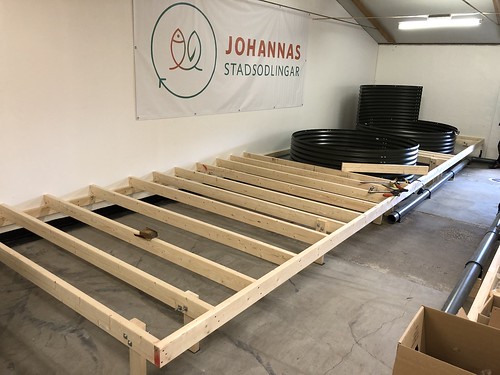
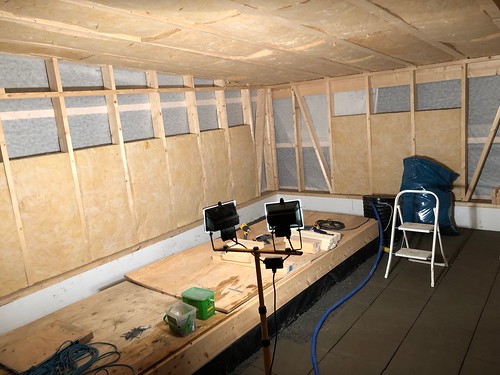
The room that previously had the stall for the calves needed to be furnished to have a table for sowing and the small plants. We call it the cutting room or the calf room. First we needed a floor so we could install new drains.
Here Mikael builds a table for the small plants, that will stand in water in trays.
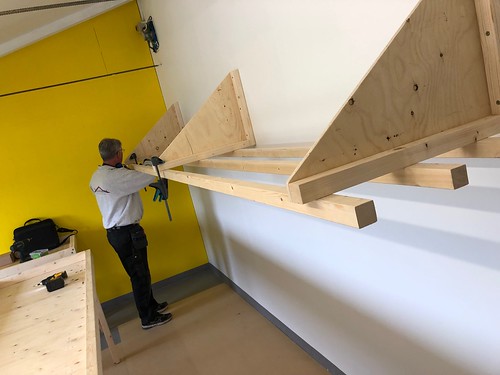
We thought for quite some time about how to hang the LED lights. In the end, it was a fairly simple construction in wood that actually works really well. Mikael came up with a good design in the end.
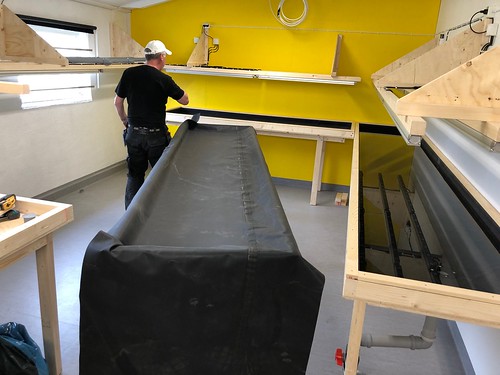
The tables being covered by rubber lining.
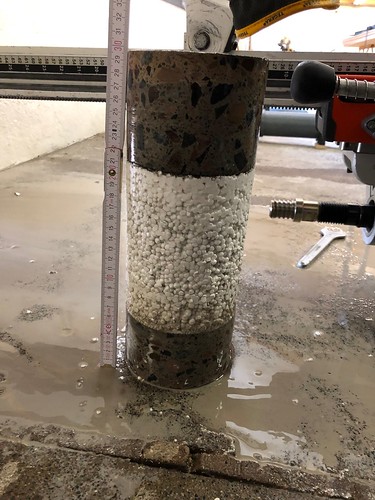
Building the large troughs for the plants was quite a lot of work, as the floor tilts quite a lot. We have a 10 cm difference between the highest and lowest point on the troughs at a distance of five to six meters. Each piece must be sawn perfectly and measured in place with a laser.
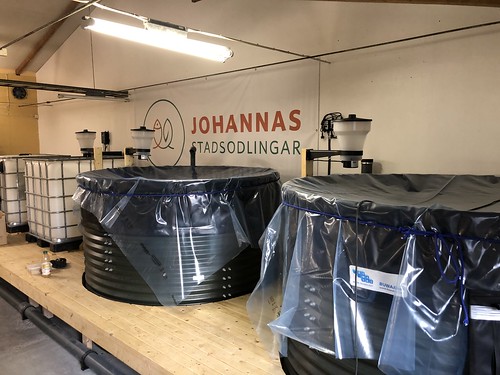
We bought rainwater tanks with custom fitted rubber lining as fish tanks. Two tanks that hold approximately 9.5 cubic meters. We do not recommend that choice, but more on that later. Here Mikael cuts a hole for the outlet.
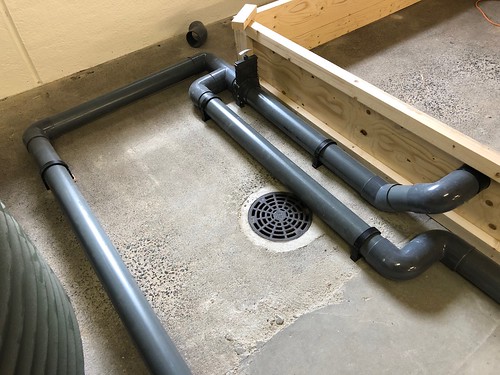
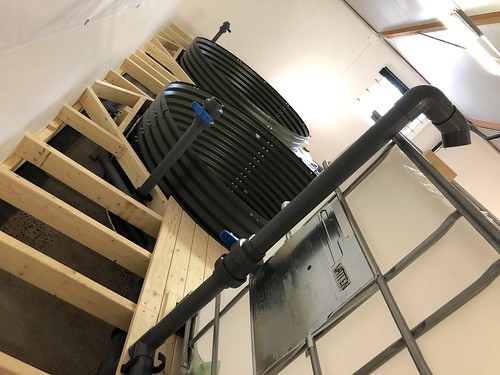
Piping with 110 mm PVC-U pipes from the fish tanks to the cultivation troughs. There you can also see the evacuation well that we created at the lowest point in the event of a flood. It turned out to be good to have in the future on several occasions.
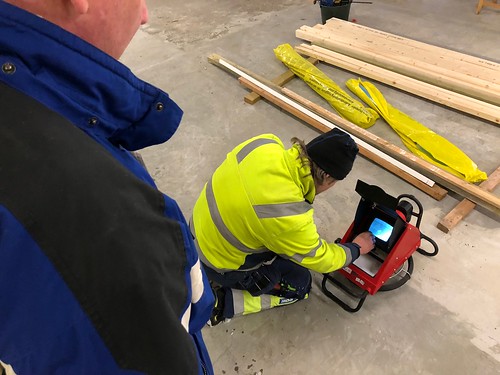
In parallel with this work, work was also underway to build our sensor system. Here, Stellan shows the first sensor hub, which measures slightly different things in the cutting room: light, temperature, humidity, carbon dioxide. We later added a sensor to the electricity meter. It also acts as a hub in the alarm system and has, among other things, an SMS modem.
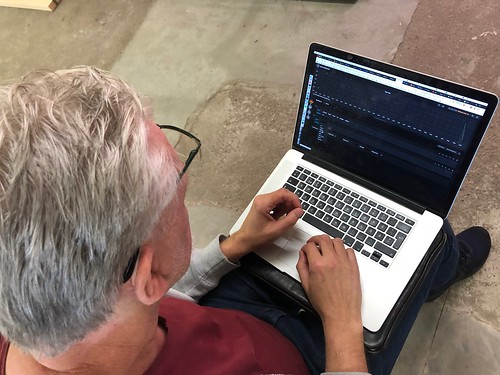
Here Gabriel is inspecting the first data packets that arrive to our data visualisation system which is based on Grafana and Graphite.
Now we needed to connect the water system inside the building, fish tanks and cultivation troughs to the outside where the sump tank will be located. Mikael drills holes in the wall.
Here you can see that our building is well insulated. We have about 15 cm of cellular plastic between the inner and outer wall.
Then we started constructing the building where the sump tank is located. We needed to cast pillars on which the foundation will rest. It was really shitty weather when Mikael and William made the holes for them with a drill.
We prepare a stable and insulated base for the sump tank.
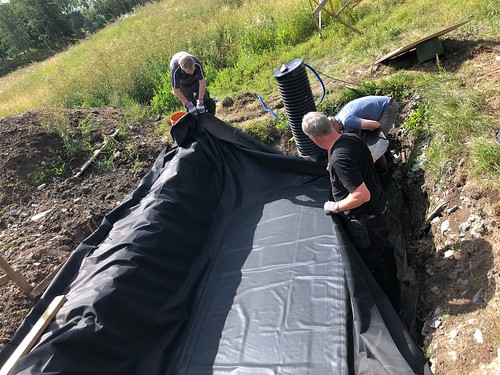
Then we lay the rubber lining that should be on the outside of the sump tank. (It’s made of wood, so it needs to be protected.) We got good help here from Stellan and Gabriel.
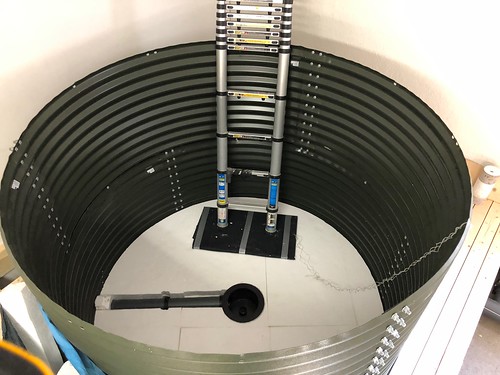
The sump tank is put in place and then we put on the internal rubber lining.
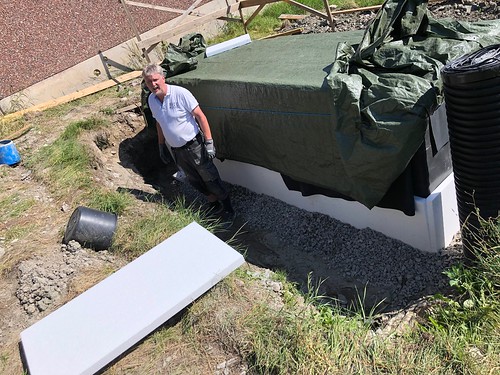
The sump tank gets insulation. We also cover it up so that it doesn’t fill with rain until the roof gets built.
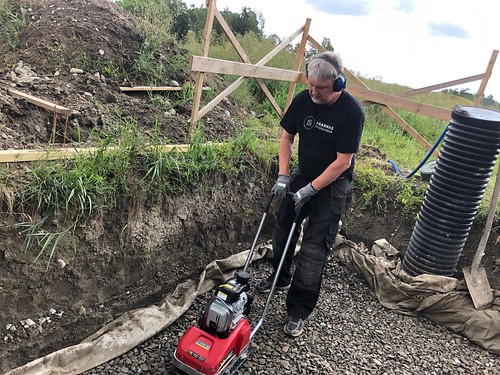
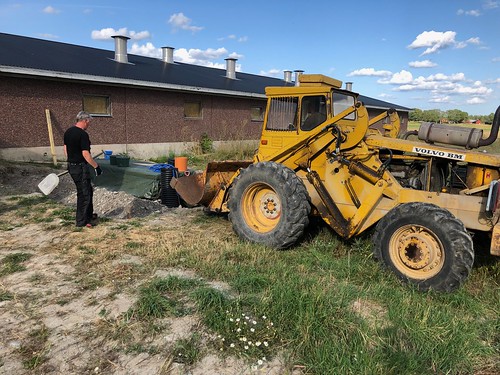
Filling with gravel and soil around the sump tank. William drives his large back loader from Volvo, which we are very happy to have had access to.
Then we started to build the platform, or pier as we call it, around the fish tanks, on which the filter tank will also stand. We see William adding floor boards.
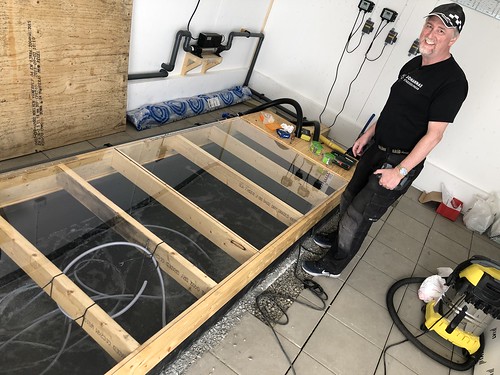
The concrete floor that we have in the building is more or less in direct contact with the ground below, so we wanted to insulate the cultivation troughs. In addition, the rubber cloth becomes less sensitive if you have to walk on it if there is not a hard surface underneath. Here we have a timelapse of installing insulation, the rubber mat and the air hoses in one of the troughs.
We have installed air stones in the troughs to make sure that we do not get stagnant water and enough oxygen for both the bacterial culture and the plants’ roots. It is possible that we went a bit overboard with the amount of stones.
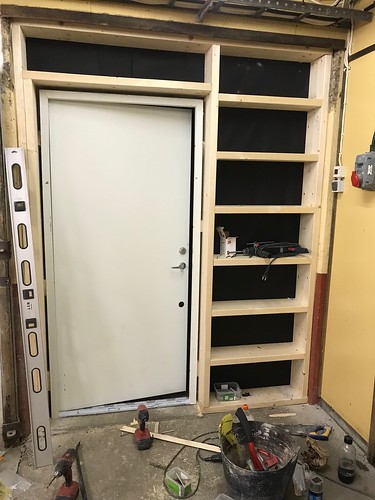
We also had to replace all the doors, which we got second hand.
We insulated the fish tanks at the bottom, so that they came at the right height for the outlets and pipes. After the rubber lining was installed in the tanks, we covered them to avoid getting building dust in them.
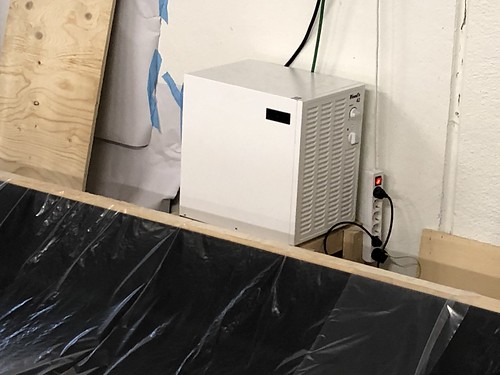
To reduce the humidity in the main growing room, we chose to install a dehumidifier. It will be more expensive in the long run than installing proper ventilation, but for now we can make do with a dehumidifier.
The it was time to build the sump tank building. That turned into many a late night.
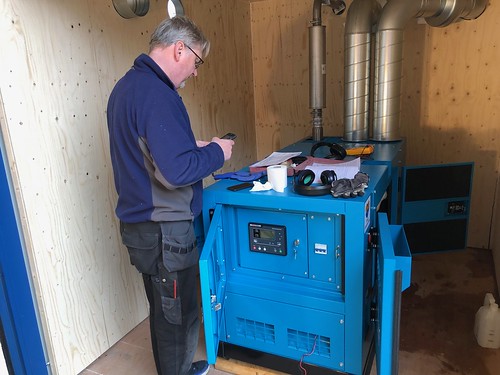
Installation of the air pumps. It was good that we had a well-insulated sump tank building to install them in. They make a lot of noise.
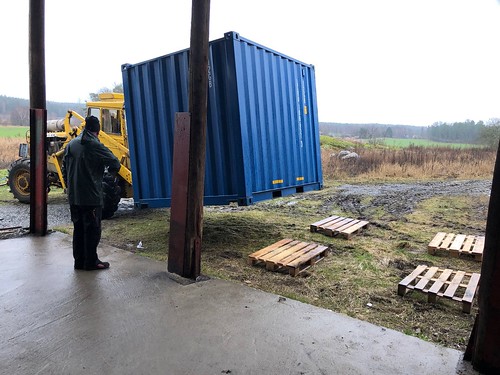
The electricity network where our facility is located is not good. So a backup generator is necessary. But, since we work with live animals, we must have reserve power anyway. Here comes an insulated container for the backup generator.
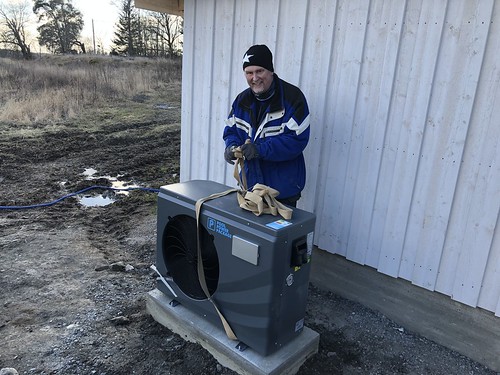
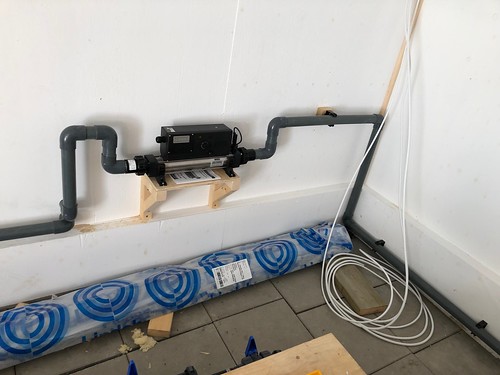
To maintain the right temperature in the water, we have an air-to-water heat pump. For emergencies, there is also an electric heating cartridge installed, which the reserve generator is able to handle the load from.
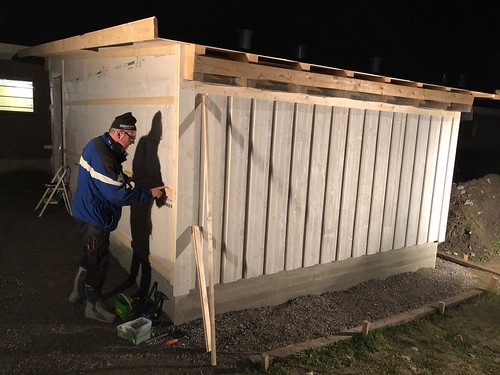
When the weather got better, we were able to finish the roof of the sump tank building (Tomas working on it) and paint it (Anke).
We also installed a plexiglass lid on the sump tank so it is easy to see that the air pumps work and that the water level is where we expect it to be.
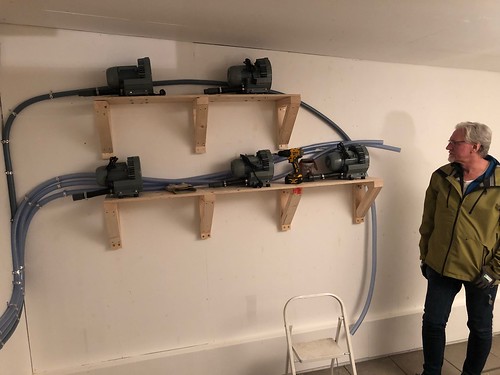
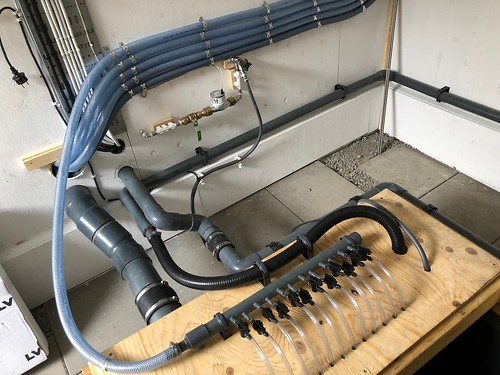
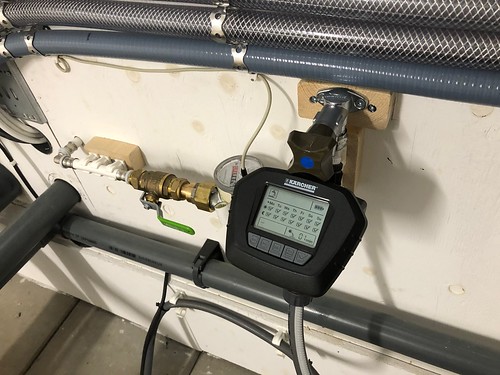
Detail of water piping, air hoses, water meter, electric wiring etc.
When we started filling the system with water, it turned out that we did not do the right thing when we glued the pipes. Many of the pipes needed additional gluing before we got rid of all the leaks. It took several weeks of work. Tip: When gluing PVC-U pipes, have plenty of glue on both pipes. Rubber lining bushings must have suitable glue properly applied.
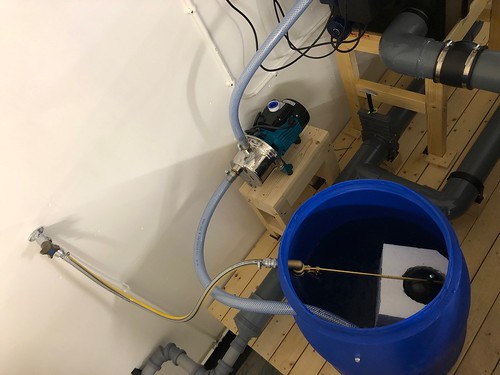
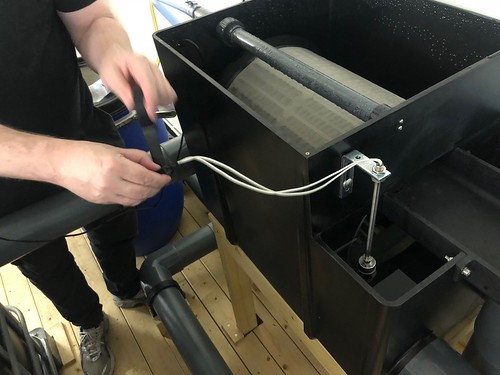
Our first attempt to feed the pump for the drum filter used a 120 litre barrel and automatic filling with well water. We had problems with the drum filter flushing at the wrong time or for too long. For that the barrel did not hold enough water. We redesigned this completely. At first we switched to taking water from an IBC tank, but in the end we did what we were supposed to do from the beginning: take water from the clean side of the drum filter.
We had to install a max water level sensor on the drum filter to regulate the flushing pump.
When we were satisfied that the leaks were fixed and that the filter flushing worked well, Lisa added bacterial media to the bacteria tank (Moving Bed Bio Reactor – MBBR).
We fed the bacterial culture with a little ground up fish food, but mainly with food grade ammonium chloride in powder form. The ammonia was added to a bucket of water the day before it was to be used and then bubbled with an aquarium pump for 24 hours to get rid of some of the chlorine. When the nutrient levels started to rise (ammonium converted to nitrite and nitrite to nitrate) we started to grow plants in the troughs.
Even without fish in the system and very low nutrient levels, we saw surprisingly good growth, which was even better when the fish arrived.
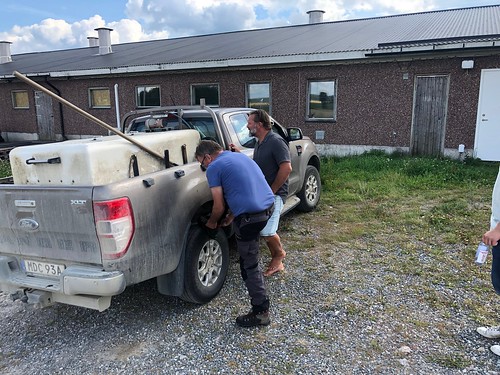
But eventually the fish came to our system. Here Tomas talks to Peter who delivers our smolt. We use rainbow in our system from 50 grams to 1.2 kg.
The sensor system measures a number of different parameters every minute. Here you can see some.
The sensor system delivers data locally to a small computer, but also to our cloud service, so that we can access the data on our mobile phones around the clock, without opening the internal system to the outside.
The sensor box in the sump tank house also talks to a weather station that sits on the roof. (Even when it is zero degrees outside, we have 30 C in the sump tank house, it may have been a little too well insulated …, the heat comes from the air pumps.)
Inductive water sensor on the outlet pipes to the fish tanks. It is one of the systems that can send alarms directly to our mobile phones if the water stops flowing in the pipes.
Automatic water filling for the sump tank. We take system water to rinse the drum filter. That water goes to the manure tank. The fish feces and that water eventually becomes manure for the fields around the farm. Now water recovery in our system is about 99.5%, which we think we can improve to 99.9% or better when we start processing the fish feces for reuse in the system (remineralising it) instead of making manure for the fields.
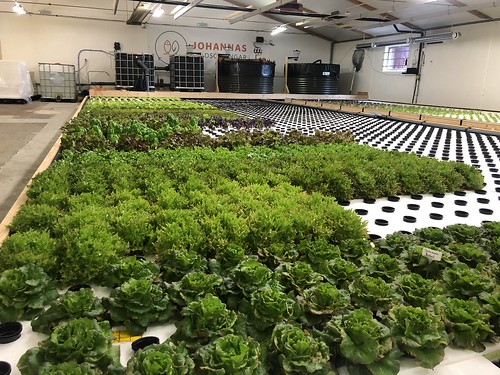
A picture of the system in production. We have faster and better growth of our plants than we expected!
In the next post, we will discuss a our sensor and data system.
This is a description of how we at Johannas Stadsodlingar (urban farms) and Concinnity together have built Johanna’s aquaponic pilot facility. We want to share how we did it and our thinking behind it. There is quite a lot to think about, so there will be several posts to cover most things.
Our pilot facility consists of 290 m2 in an insulated building that was previously a cow barn for about 140 cows. The farm was built in the mid 80’s and was then very modern. We have taken a third of the space available in the farm building. The pilot plant uses three rooms: the large cultivation room, of approximately 220 m2, the seeding/sappling room 24 m2 and the ”packaging room” 20m2. The rest are side surfaces.
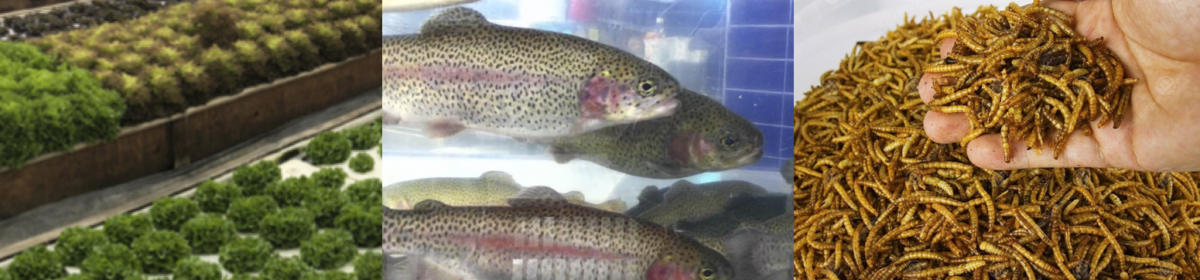
In the pilot plant, we will grow leafy greens, spices and rainbow trout (yes, nitrification bacteria of course).
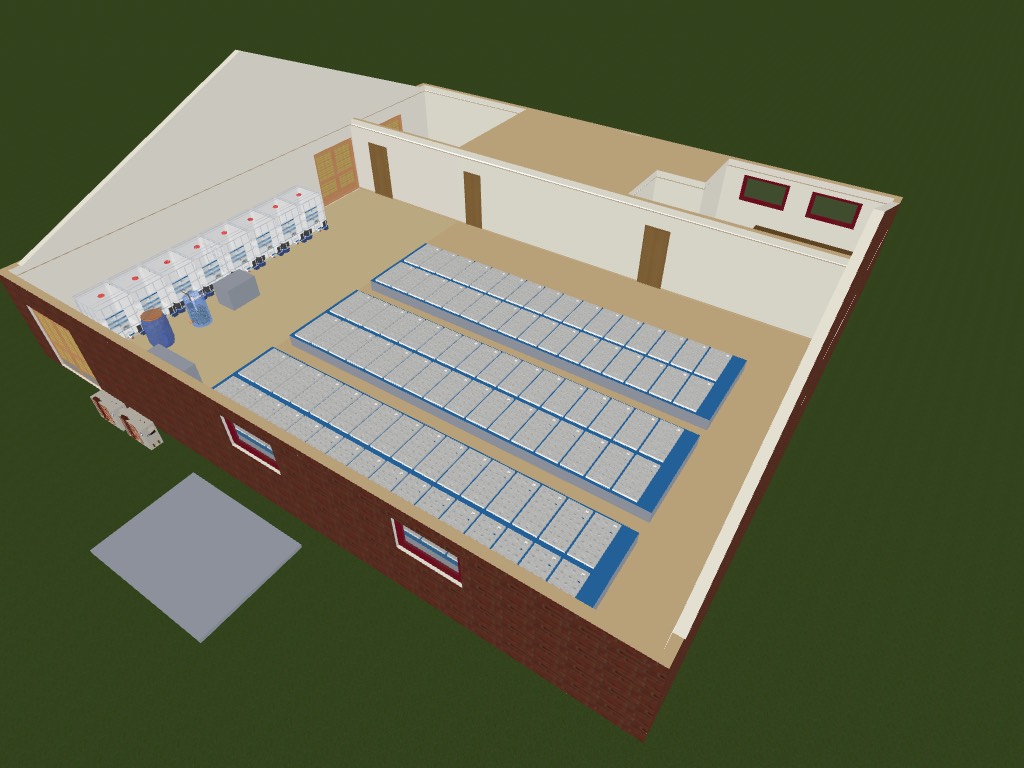
The first design was based around IBC tanks and three cultivation troughs with 60 x 120 cm rafts. Outside the building there is an area reserved for the sump tank. The fish would be in IBC tanks. We thought of using a radial flow separator to remove the coarsest solid particles and a filter box for the finer particles. Just as described in The Aquaponic Farmer (see part 1).
One of the first designs of the Johannas aquaponic pilot facility (version 3).2D drawing of one of the first designs (version 4).
In the floor plan above, you can see that we have already rethought using two cultivation troughs instead of three. A narrower trough for rafts from Meteor Systems and one with more traditional rafts from Royal Brinkman (120 x 60 cm). In the Meteor rafts, we use a smaller substrate plug with significantly less material consumption. In the Brinkman rafts we use plastic pots. We were not sure what would work best in the Swedish market, so we wanted to try both.
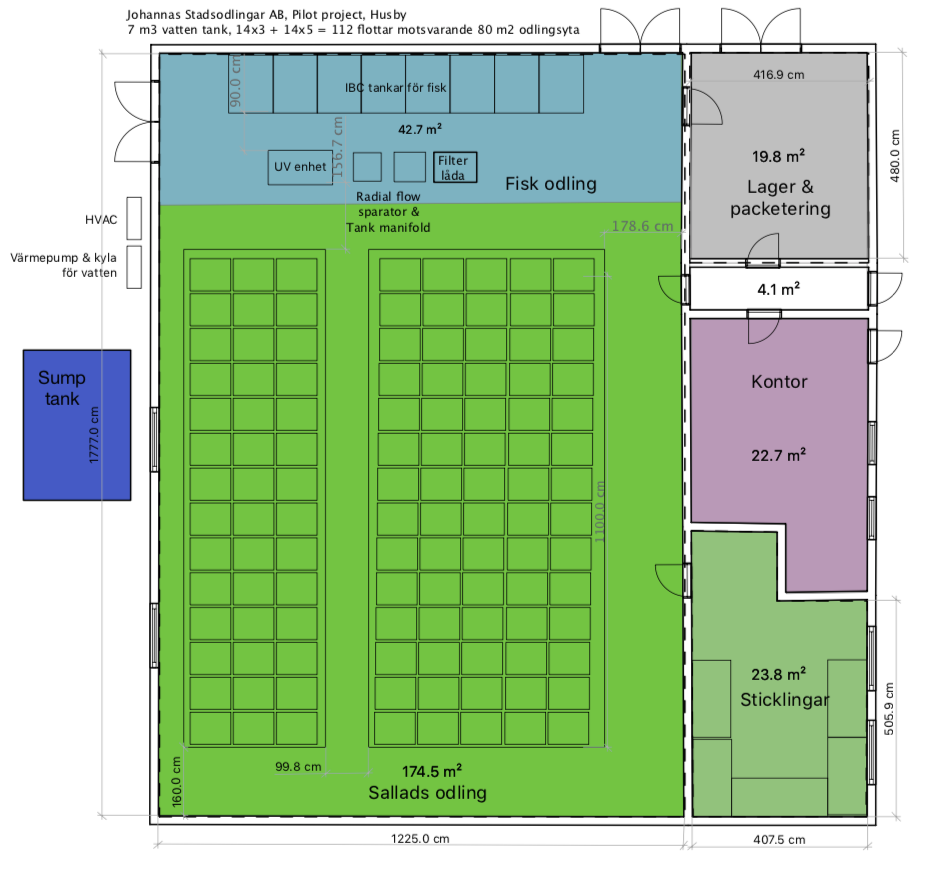
Since we have a concrete floor, we can not have part of the filter system below the throughs easily, so we investigated other options for the filters. We chose to have a small drum filter instead. At the same time, we began to wonder if the fish we had decided on, the rainbow, would not feel much better in round tanks. In addition, we realized that the sump tank would need proper protection, so we started planning a building over the tank. Eventually, that building became our engine room as well. It turned out that this was very good, but it was a lot of work.
To have better access to the room where we ship out vegetables, we turned the design so that the fish tanks are furthest from the packing room, while it also has less people moving around the fish tanks (the doors are not there) which reduces stress for the fish. The round fish tanks are also more volume efficient.
Round fish tanks and the design flipped 180 degrees (version 8).
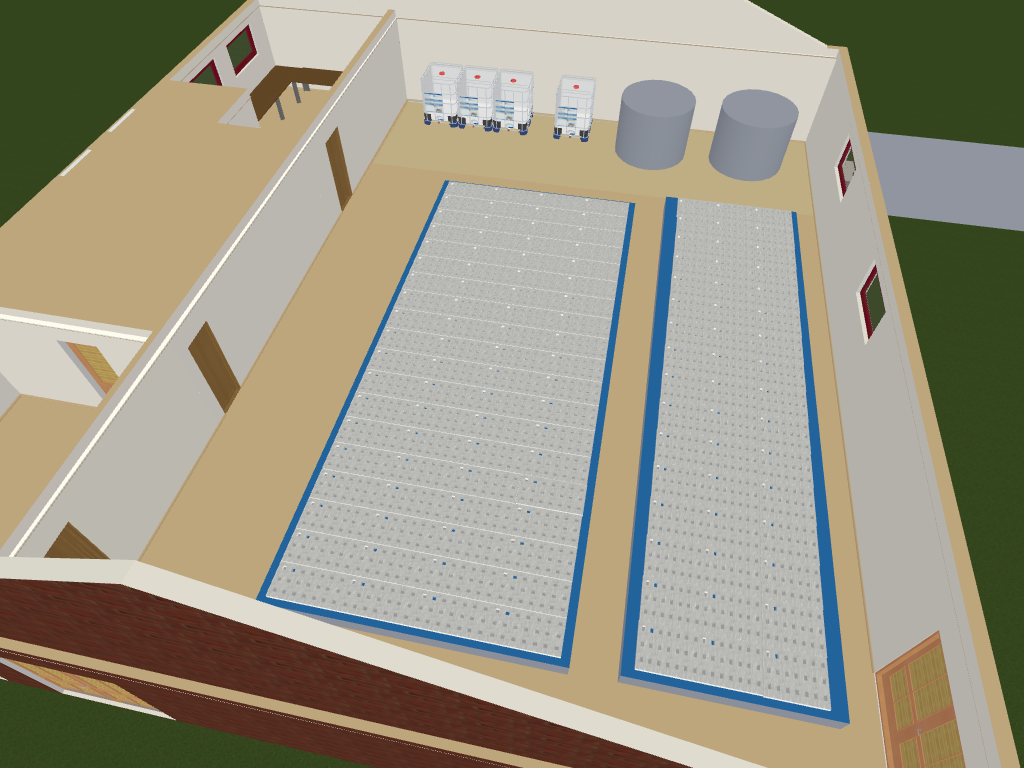
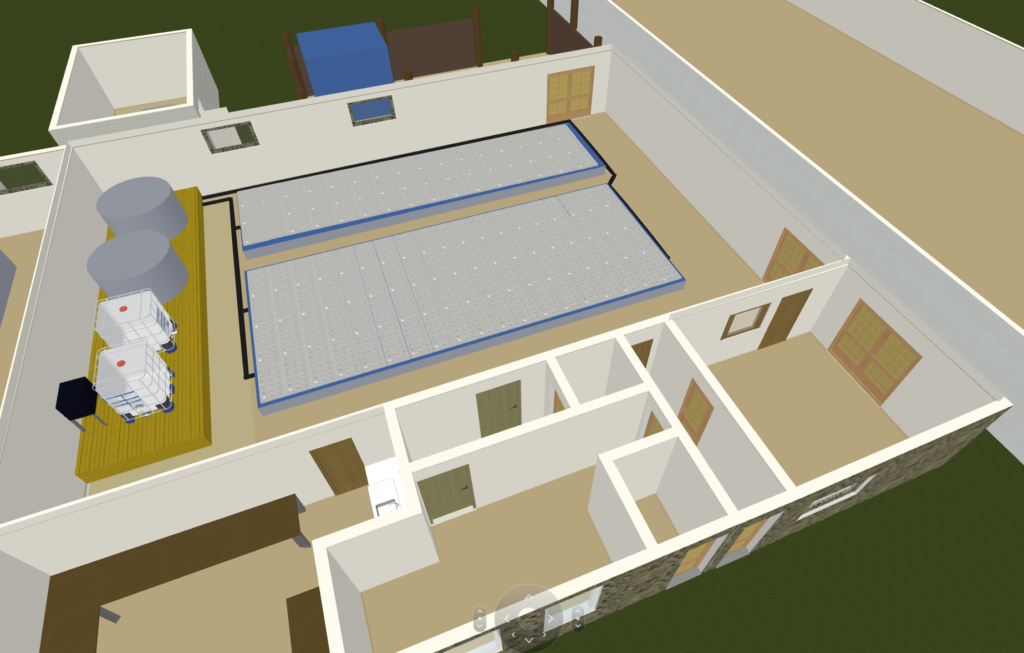
In the final design (below) you can see that we added a ”pier” around the fish tanks. The tanks were so high that it would be better to be able to get up a little when working there, without having to stand on a footstool. At the same time, we wanted to get the filter tank (Moving Bed Bio Reactor, MBBR) up from the floor, as the water level in our design is determined by the outlet on the filter tank as well as avoid pipes on the floor so you do not have to step over them all the time. Despite a lot of thinking around this, some of it came out less than optimal. We have a higher water level than we think is good and it would be quite a lot of work to rebuild it to lower the level. But, as I said, the goal of a pilot plant is to learn.
Final design of the pilot facility (version 12).
The facility has 3782 growing places in the two troughs, approximately 3200 growing places (depending on which trays you use) in the tables in the sampling room. We can have a total of about 7000 plants in the system at the same time.
The water tanks are 9.5 m3 each. We have an IBC tank as MMBR (1m3). The sump tank holds approximately 4 m2, but we normally use 2 m2 of the space. The cultivation troughs together hold approximately 23-25 m3 (depending on how high the water level we set). Together, the total system uses approximately 35 m3 of water. We also have an IBC tank that will be used as a quarantine for incoming fish and preparation tank before slaughter.
On the far side of the building you can see the sump tank building (beyond the round fish tanks) and the blue cube is a three meter container that contains a diesel powered generator.
In the next blog post we will document our building process in a build logg.
This is a description of how we at Johannas Stadsodlingar (urban farms) and Concinnity together have built Johanna’s aquaponic pilot facility. We want to share how we did it and our thinking behind it. There is quite a lot to think about, so there will be several posts to cover most things.
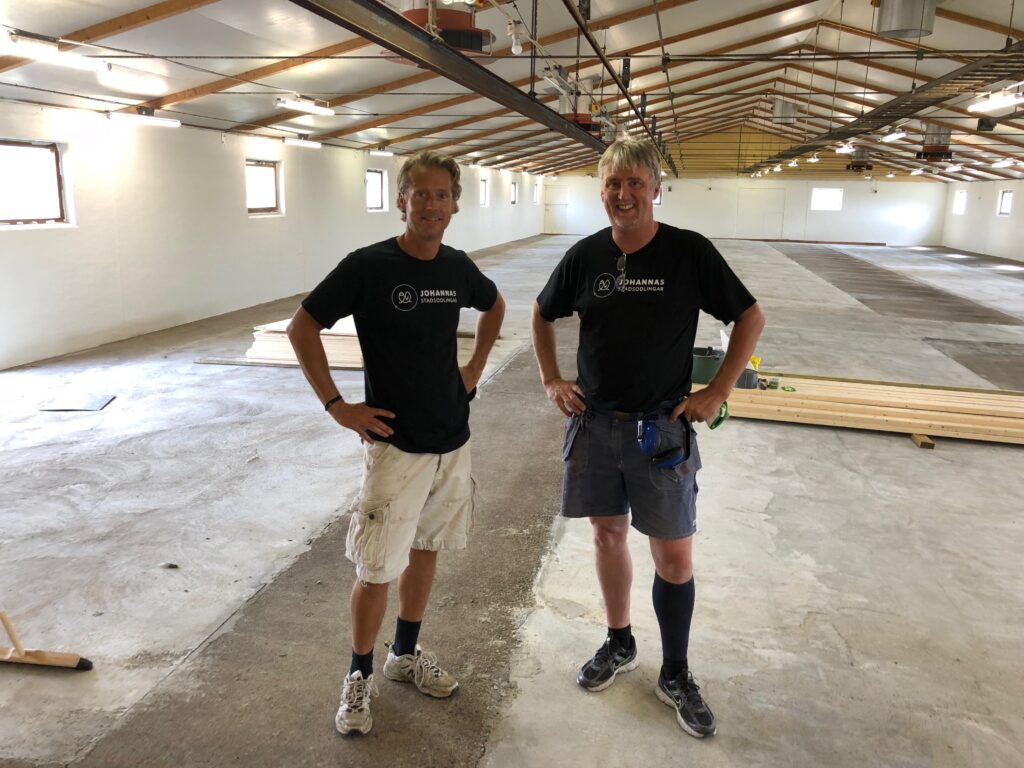
Three years ago, we at Johannas decided to start a company that produces food in circular production systems on a large scale. We started with fish and vegetables. The method we are going to use for this is called aquaponics. We have experience from cultivation and to start and run companies up to 100 employees. We have been studying circular cultivation systems for many years. However, we have not run an aquaponics operation before and we know that one of the problems people encounter when they start with aquaponics is that they often build a large-scale facility too early. You have to learn how to run an system which contains a mini-ecosystem with fish, bacterial cultures and vegetables. We decided to build a pilot plant at Husby farm in Vallentuna, north of Stockholm. Husby farm is owned by William, who is a partner in Johannas. We chose to use a third (290 m2) of a former dairy farm, which is about 900 m2.
William and Mikael in the old dairy farm at Husby.
If you are going to build an aquaponic facility, large or small, you should study first. We have three sources of information and inspiration that we can recommend.
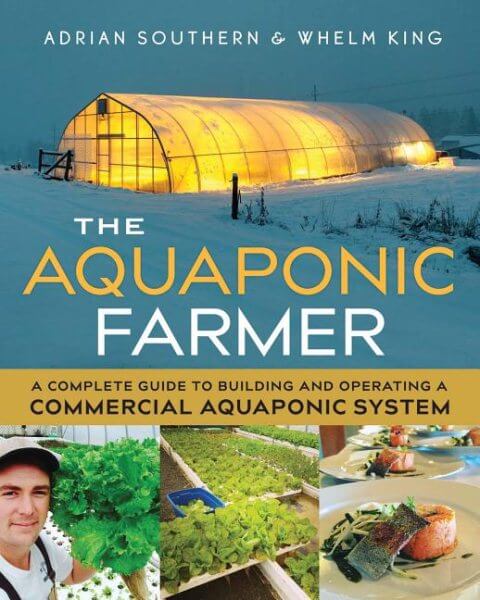
Our aquaponics design is partly based on a description from the book The Aquaponics Farmer: A Complete Guide to Building and Operating an Aquaponic System, by Adrian Southern and Whelm King.
The Aquaponic farmer, Southern & King.
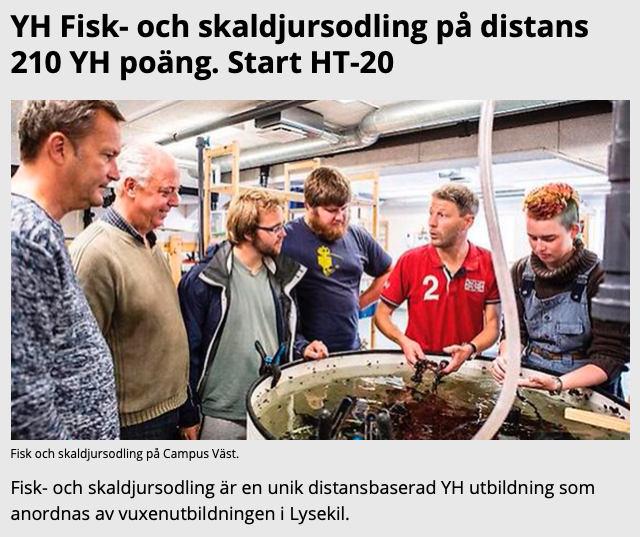
If you want to run an aquaponic facility on a smaller scale, say 1000 m2 of cultivation area. Then you might be able to cope with what you learn from the books. But we strongly recommend that you participate in some formal training, and example of this is the one-year course Fish and shellfish farming, which is a distance learning course in Sweden. Fish farming is the most sensitive part in aquaponics, and it can be very problematic if the fish dies. In addition, there are legal requirements in Sweden (and probably other countries) to have appropriate training in commercial animal husbandry.
Picture from the Swedish fish and shellfish long distance learning course.
We have also learned a lot from study visits, including at:
There are many more aspects of running an aquaponics facility that you need to have knowledge of. We decided to buid our pilot plant all by ourselves (with a few exceptions), primarily as we think you learn a lot from it. It is a lesson that is well worth it in our eyes, as we intend to scale up what we do much larger, and then we need to understand why things are designed as they are. In your team, you should have at least basic knowledge of the following:
Aquaculture
Vegetable growing
Water chemistry
Ecosystems
Sales and marketing
Business economics, such as accounting etc.
Food safety
Technical systems, such as pumps, oxygen meters, cooling, heating, etc.