This is a description of how we at Johannas Stadsodlingar (urban farms) and Concinnity together have built Johanna’s aquaponic pilot facility. We want to share how we did it and our thinking behind it. There is quite a lot to think about, so there will be several posts to cover most things.
- Part 1 – start and prior knowledge
- Part 2 – design
- Part 3 – build log
- Part 4 – water quality and nutrients testing (this blog)
- Part 5 – Production management
Cultivation Management Platform
The digital systems we have built are based around the vision we set out with at the start of the project. We call it the Cultivation Managment Platform.
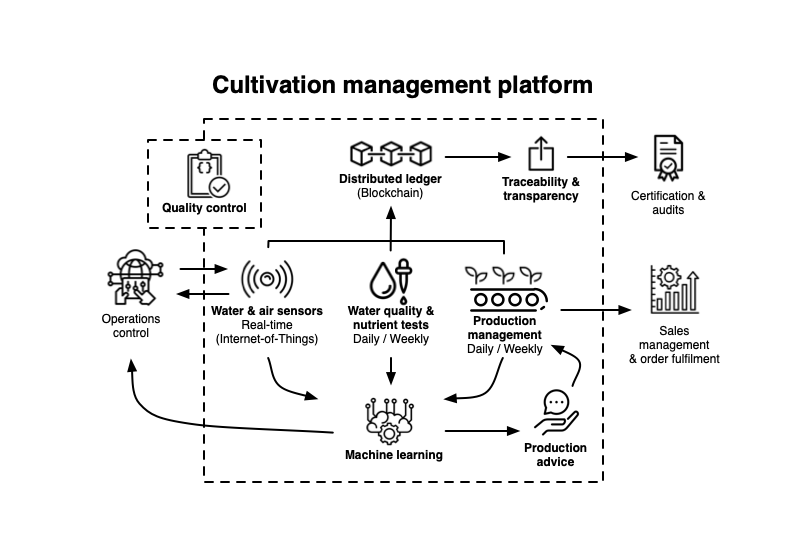
The CMP consists of four parts:
- Water quality and nutrients tests
- Water, air and automation sensors
- Production management
- Distributed ledger / block chain
In this part we will describe our work with Water quality and nutrients tests.
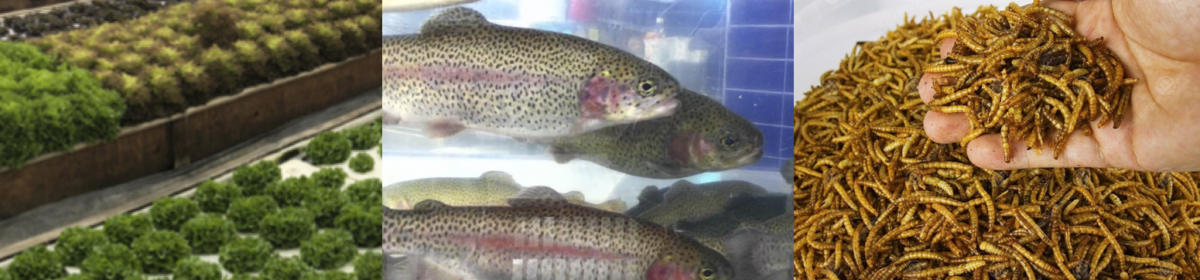
An aquaponic farm is an ecosystem with many ”moving parts” and you need continuous, precise monitoring of it with the help of both manual and automated systems. On top of that it’s important for us to acquire as much knowledge as possible about the ins and outs of how the system actually works, like how long time different plants take from seed to harvest, how much the fish grow and so on. We use our CMP to achieve these goals with the help of modern technology in combination with our knowledge on plant and fish cultivation.
Water quality and nutrients tests
To get an understanding of an aquaponics system and to be sure that ”everything’s all right” we need to make regular tests of the water to be able to discover any problems that might arise and to analyze how the water quality affects the system as a whole.
When the system was started and the bacterial culture for the nitification process was built up, we took measurements every day to get good control and understanding of the growth process. Now, when the system is up and running in a stable manner, we measure most indicators once a week.
We had initially planned to use a system for data collection and analysis that we have worked with before, Avo Flow by Akvo Foundation. Akvo Flow consists of an Android based app for data collection with a web based backend for admin and visualization tools, along with an integration with photo-metric and other water quality sensor systems called Akvo Caddisfly. However we realized that the amount of reagent chemicals needed was larger than what was advisable in our fairly small pilot system.
Thus we chose to use a combination of photometric and other sensors from different suppliers. One of the down sides of this is that these other components have very poor or totally lacking digital integration, so we now have a large spreadsheet instead for all the data we collect this way.
| Indicator | Sensor | Comment |
| Alkalinity | eXact iDip, ITS | |
| Ammonium | eXact iDip, ITS | |
| Phosphate | eXact iDip, ITS; Checker, Hanna Instruments | eXact iDip can only be used up to 3 ppm |
| Hardness | eXact iDip, ITS | |
| Iron | Checker, Hanna Instruments | |
| Potassium | Photometer Potassium, Hanna Instruments | |
| Dissolved oxygen | Handy Polaris 2, Oxyguard | Portable reference meter |
| Nitrate | eXact iDip, ITS | |
| Nitrite | eXact iDip, ITS | |
| pH | pH-Checker, Hanna Instruments | Portable reference meter |
Digital monitoring – Water, air and automation sensors
The system we developed for collection, storage and presentation of real-time data consists of two main parts. The system that collects the data is called Aquasensor and the system for storage and display of the data is called Aquadata.
Critical indicators as well as indicators that are relatively easy to measure are automatically measured every minute by the sensors. These sensors are connected to Aquasensor which is a tailor-made program written in the programming language Python. Aquasensor communicates with the sensors and collects raw data which is converted into measured values and then, via a buffer program, Grafsy, sends this data to the storage part of the system. The following are the most important indicators we measure:
| Indicator | Sensor | Comment / unit of measure |
| Electricity usage | Electricity meter with pulse output | 1 pulse/Wh (1000 pulses/kWh) |
| Light | TSL2561 | Lux |
| Air: temperature | Sensirion SCD30 | °C |
| Air: humidity | Sensirion SCD30 | % |
| Air: CO2 | Sensirion SCD30 | ppm |
| Sensor hub, CPU-usage | The Linux operating system | |
| Sensor hub, mains electricity | 230-volts relay | on/off |
| Sensor hub, network packets | The Linux operating system | |
| Sensor hub, SMS signal strength | 3G-modem, Huawei E303 | % or dBm |
| Water: electric conductivity | Sensorex CS150TC | mS/cm |
| Water flow | XKC-Y25 inductive detector | on/off |
| Water intake | Water meter with pulse output | 53 pulses/liter |
| Water: dissolved oxygen | Vernier Optical DO | mg/l |
| Water: level measurement | Ultra sound sensor, JSN-SR04T and a float switch | cm |
| Water: pH | Sensorex pH2000 | |
| Water: temperature | Dallas DS18B20 | °C |
| Drum filter cleaning | 230-volts relay | on/off |
| Weather: humidity | USB-connected electronic weather station | % |
| Weather: temperature | USB-connected electronic weather station | °C |
| Weather: air pressure | USB-connected electronic weather station | hPa |
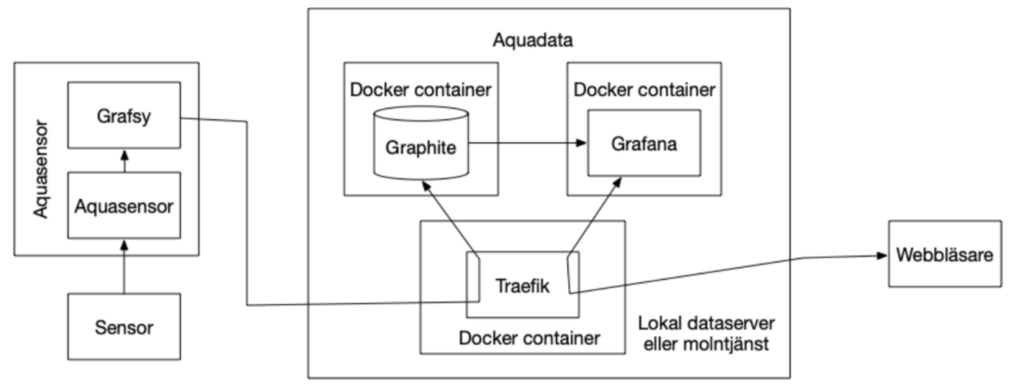
The storage and display system, Aquadata, is based on the two open source software systems Graphite och Grafana.
Graphite was originally a tool for monitoring computers. It has a database that is tailored for storing time series and is therefore well suited for other time-oriented data, such as sensor data from our aquaponics.
Grafana is a tool for visualizing data, with enormous flexibility in terms of the ability to combine information into larger dashboards. Several graphs can thus coexist on one screen and each graph can contain several different types of data, combined in a logical way.
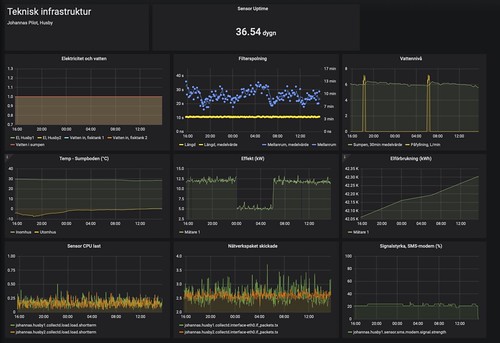
Grafana dashboard with data from Johanna’s pilot site
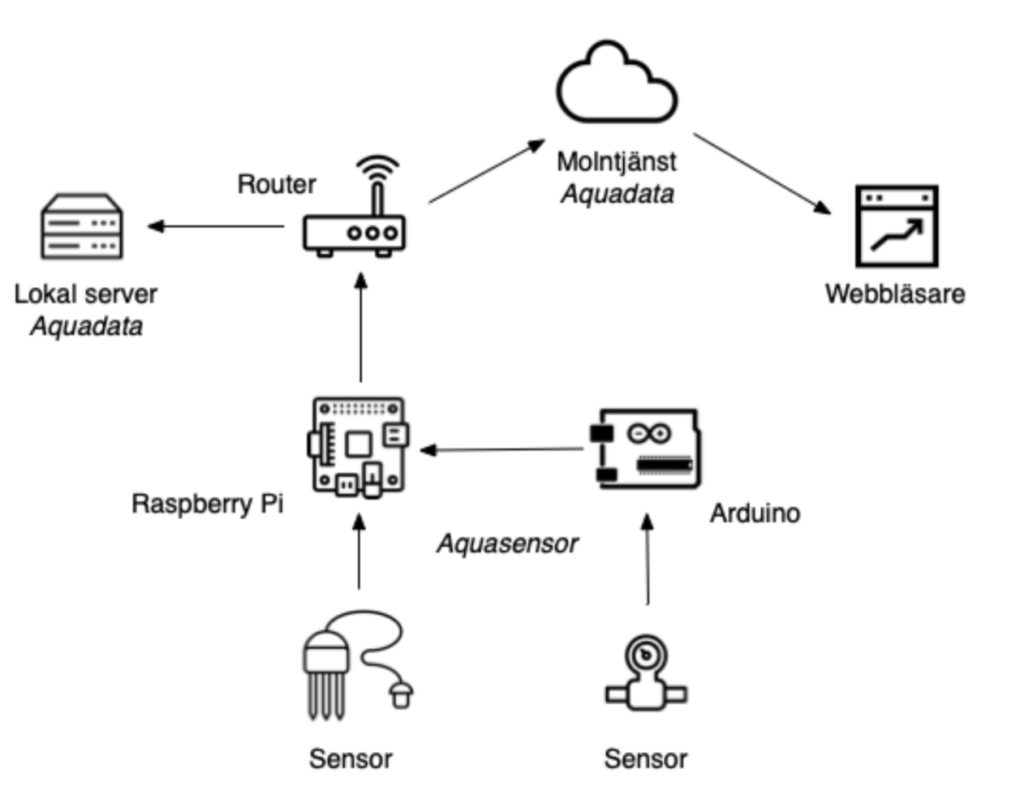
System implementation – Aquasensor
Aquasensor runs on RaspberryPi computers, we call them the ”Pies” or sensor hubs. We currently have two of them that collect data from different parts of the cultivation. Every full minute, data is collected from the sensors. Aquasensor uses a supporting software, Grafsy, to temporarily store the collected information. In turn, Grafsy sends data to the Aquadata storage system. Grafsy ensures that all information is delivered and data from several hours of measurements can be stored if communication with Aquadata is temporarily interrupted. A sensor hub can also have a ”sub-hub” which is an Arduino computer with sensors. Some sensors are easier to communicate with from an Arduino. Since power outages can occur, the Pies have backup power in the form of battery packs. They are of the same type that you can use to charge your mobile phone. In this way, Aquasensor can continue to monitor the cultivation even if the power goes out. If reserve power is available to the router, Aquasensor can continue to send data even during power outages, if the router does not work, the information is buffered in Grafsy until communication is re-established.
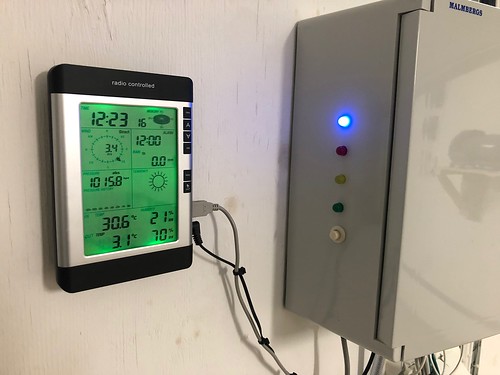
Aquasensor connected to an electronic weather station (which uses wireless communication to get data from sensors on the roof).
System implementation – Aquadata
Aquadata is a system built around the open source software Graphite and Grafana. Graphite stores all information from the sensors and Grafana presents data in graphs that can be collected in dashboards. With these two systems as a base, we have built a cloud service that enables storage of sensor data over the Internet and access to the information in the same way.
Data and time series
Data collected by Aquasensor is sent to Aquadata. There it is stored in Graphite, a database that is tailored for storage of so-called time series, i.e. data containing a timestamp. When Aquasensor sends data from a sensor, it is in the form: ”name timestamp data”.
The configuration of the storage is automatic, when a measured value enters Aquadata, it is automatically added to the named series. If the name does not exist, it is created in the database and the information is added there as a first entry.
Example
Aquasensor sends the following data:
johannas.husby1.sensor.luft.co2.stickling 2020-12-14T02:16:00+02:00 348
The name of the measured value, johannas.husby1.sensor.luft.co2.stickling, contains a lot of information that specifies the kind of data we’re sending. The name is is made up of sub-names in a hierarchical structure. The first two parts of the name, johannas.husby1 is the facility we send data from. Then follows what type of data it is, sensor.luft.co2, i.e. carbon dioxide, and finally the name, stickling, of the sensor from which the measured value comes, in this case the sensor in the seedling room. Using this type of hierarchical names you can build logical structures for your data which in turn makes it easy to find the right information when it is to be presented in graphs.
The next part of the data is the timestamp, 2020-12-14T02:16:00+02:00. Most measurements are made every full minute, with the exception of EC (electric conductivity; measured by running a weak current through the water) which is made on the half minute so as not to interfere with the pH that is easily affected by it.
The last part of the measurement is the measured value, i.e. the data itself, 348. The unit is specified when creating the visualizations and is not part of the value, but is in most cases obvious. In the case of carbon dioxide content, it is ppm, parts per million.
Graphs and dashboards
The collected data is presented by Grafana, an open-source software for visualizing data. With Grafana, we have built dashboards, information panels where we collect information that ”fits together”. We currently have three main panels, Water, Cultivation Rooms and Tech infra, technical infrastructure. The water panel shows the values for temperature, oxygen content, pH and electrical conductivity. The Tech infra dashboard shows more ”physical” measurement values such as electricity consumption (and that we have electricity at all!), the system’s water level (to be able to alert if we get a major leak) and monitoring of the drum filter whose activity is indirectly an indication that the system is OK. The Cultivation Room panel shows the measurements we take in the seedling room, such as temperature, humidity and carbon dioxide content.
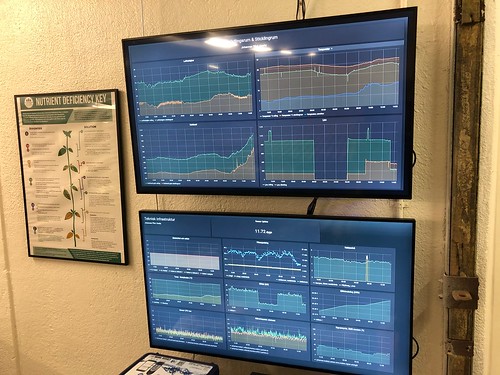
Grafana dashboards on TV screens at the pilot site
Alterts
Aquasensor and Aquadata have two integrated alerting systems. On is SMS-based and sends an SMS to a list of telephone numbers in the event of an alarm condition. The second system is an integration with the cloud service PagerDuty, which can be configured to send alarms via: email, SMS and phone calls.
Digital security
Our monitoring system is explicitly not to be used to control the aquaponics. We are of the firm opinion that in the future it may be very difficult to protect ourselves from external actors who want to disrupt and/or destroy our computer systems, or to exercise digital blackmail by, for example, breaking into our system, encrypting the computer disks and request money to unlock data again. In systems that operate critical infrastructure, such as our fish farming, this should not be possible and our control systems are air-gapped, i.e. have no digital access from the internet or other external networks. This means that the data flow in our monitoring systems only goes in one direction: from the sensors to the local data server and on to the cloud service.
In the next post we will take a look at the Production managment system.
The text in this posted is licensed under Creative Commons BY-NC-SA International.